Sampling Plan and Data Collection Strategy
1. Purpose and Scope
This article defines how sampling and data collection are designed and executed during PPQ to generate representative, decision-quality data.
Focus is on practical implementation, including:
- how sampling points are selected
- how sample size and frequency are determined
- how data streams are aligned and integrated
- how variability is intentionally challenged and detected
2. Role within PPQ
Sampling and data collection operationalize the PPQ strategy. They must:
- generate data capable of confirming CPP control
- demonstrate batch uniformity and consistency
- support statistical evaluation and final conclusions
This is not data gathering for completeness. It is targeted data generation to confirm process performance.
3. Sampling Plan Design
Sampling design is based on identifying where and when variability is most likely to occur.
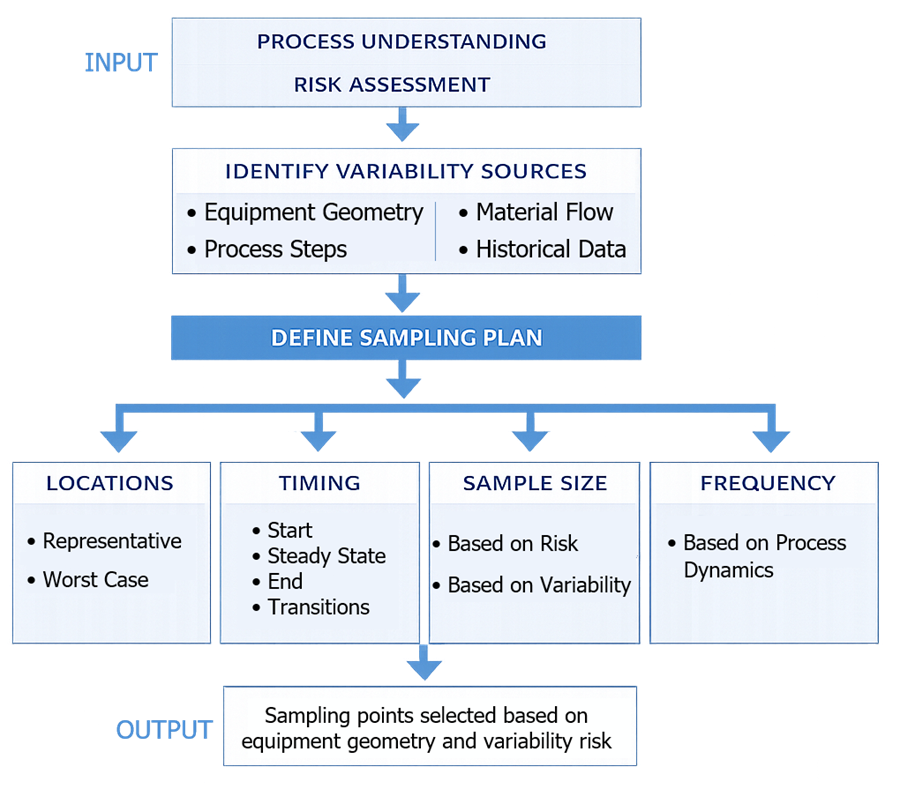
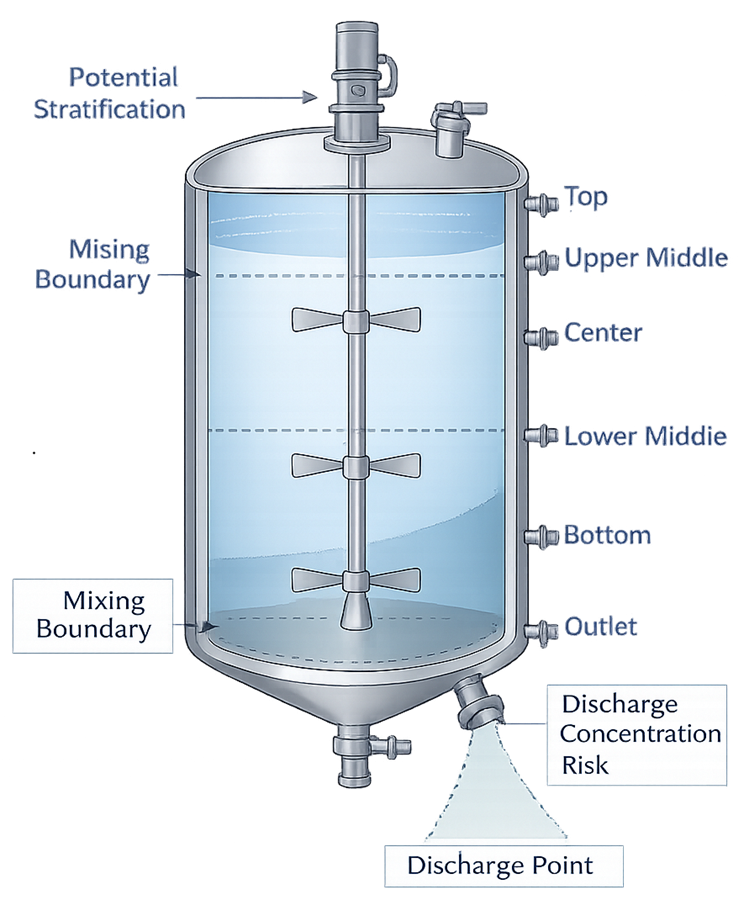
3.1 Selection of Sampling Locations
Sampling locations are selected based on where variability is most likely to occur, not convenience. Typical selection logic includes:
- equipment geometry
dead zones, mixing boundaries, top vs bottom, inlet vs outlet - process sequence
early vs late fill units, first vs last material processed - material flow behavior
segregation risk, hold-up areas, transfer points - historical or known risk areas
locations previously associated with variability
Sampling must cover both:
- representative locations
- worst-case locations
Sampling locations should reflect equipment geometry and areas where variability is most likely to occur.
3.2 Selection of Sampling Timing
Sampling timing is aligned with process dynamics, not fixed intervals. Sampling points are selected at:
- start of operation
where system stabilization occurs - steady-state operation
where process is expected to be consistent - end of operation
where depletion or drift may occur - critical transitions
changes in CPPs, phase changes, hold times
Timing must capture conditions where process behavior can change.
3.3 Determination of Sample Size
Sample size is based on the ability to detect variability, not arbitrary numbers. Considerations include:
- batch size and number of units
- expected variability
- criticality of the CQA
- required confidence in conclusions
Typical approach:
- increase sampling where variability risk is high
- reduce sampling where process is well understood
Sampling must be sufficient to:
- detect non-uniformity
- support statistical evaluation
- confirm consistency across the batch
3.4 Sampling Frequency
Sampling frequency is driven by process speed and sensitivity.
- fast or dynamic processes → higher frequency
- stable processes → lower frequency
Frequency must ensure that transient deviations are not missed.
4. Data Collection Strategy
4.1 Alignment of Data Streams
Data must be structured so that relationships between CPPs, IPCs, and CQAs can be evaluated. This requires:
- time alignment of data points
- linkage of samples to specific process conditions
- consistent identification of batch, location, and stage
Each CQA result must be traceable to:
- corresponding CPP values
- process conditions at the time of sampling
4.2 CPP Data Collection
CPP data must reflect actual process behavior, not snapshots.
Approach:
- continuous monitoring where possible
- defined recording intervals where continuous data is not available
- capture of variability within the acceptable range
Data must allow assessment of:
- stability
- excursions
- trends over time
4.3 In-Process Control Data
IPC data is used to confirm that intermediate stages perform as expected.
Collection must:
- align with critical process steps
- reflect decision points in the process
- detect early signs of deviation
IPC results should be evaluated in context of CPP behavior.
4.4 Final Product Data
CQA data confirms final product quality.
Collection must:
- represent full batch distribution
- align with sampling plan
- allow comparison across batches
Final product data is the ultimate confirmation of process performance.
4.5 Supporting Data
Supporting data is collected where it impacts process performance.
Examples:
- environmental conditions
- utility performance
- system status
Only relevant data should be included. Avoid unnecessary data collection.
5. Data Integration and Traceability
All data must be integrated into a single evaluable dataset.
Requirements:
- linkage of CPP, IPC, and CQA data
- identification of batch, time, and location
- ability to reconstruct process conditions for any sample
Data must support:
- cross-parameter analysis
- identification of relationships
- evaluation of consistency
6. Link to Risk and Control Strategy
Sampling and data collection must directly reflect:
- identified CPPs
- known variability sources
- defined control strategy
High-risk parameters require:
- more frequent sampling
- broader coverage
- tighter linkage to CQAs
7. Execution
Execution must follow the defined plan without adjustment.
- no reduction in sampling
- no substitution of locations or timing
- no omission of data points
Any deviation must be:
- documented
- justified
- evaluated for impact
8. Summary
Sampling and data collection during PPQ are designed to actively detect variability and confirm process control.
They are based on:
- targeted selection of locations and timing
- sufficient sample size and frequency
- structured data collection and integration
This ensures that PPQ conclusions are based on complete, representative, and traceable evidence of process performance.