Signal Detection, Process Drift, and Investigation
1. Introduction
Signal detection within Continued Process Verification identifies conditions indicating potential or actual loss of process control. It converts monitored data into actionable information by distinguishing normal variation from meaningful change.
This section defines how statistical signals are identified, how process drift is recognized, and how investigations are performed to maintain the validated state.
2. Role within CPV
Signal detection is the decision layer of CPV.
- Monitoring generates data
- Statistical methods identify signals
- Signal detection determines significance
- Investigation confirms cause and impact
Without defined detection and interpretation, monitoring remains descriptive and does not ensure control.
3. Definition of Statistical Signals
AA statistical signal is an objective indication that observed process behavior is no longer consistent with the expected random variation of a stable process. It reflects a change in process performance rather than normal fluctuation.
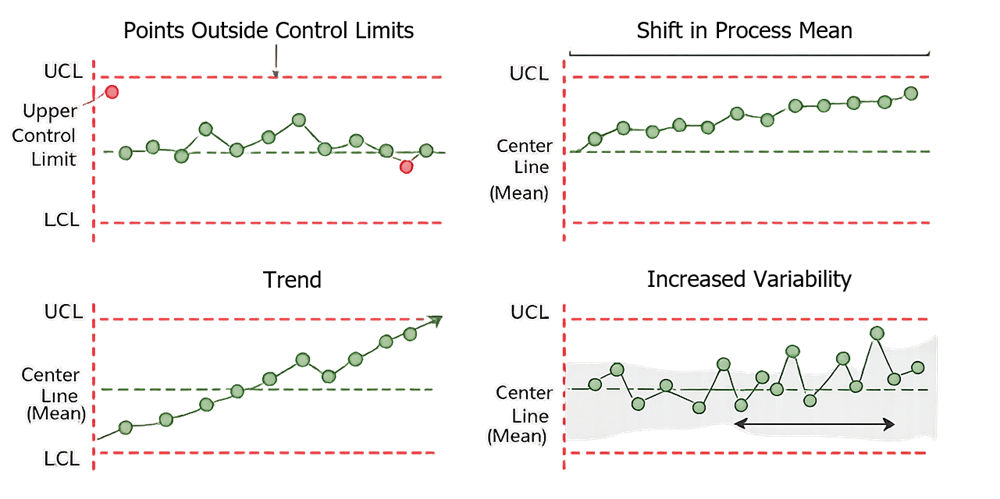
In a controlled process, data points vary randomly around a stable mean within predictable limits. A signal occurs when this pattern is disrupted in a way that is unlikely to be due to chance alone. Signals include:
- Data points outside control limits
Values exceeding upper or lower control limits indicate that the process has moved beyond statistically expected variation. This is a direct indication of loss of control. - Non-random patterns within control limits
Even when all points fall within limits, structured patterns such as consecutive points on one side of the mean, trends, or cycles indicate that the process is no longer behaving randomly. - Sustained shifts in process mean
A series of points consistently above or below the historical average indicates that the process has shifted to a new operating level. - Increasing variability or instability
Widening spread of data, increased range between points, or erratic fluctuations indicate loss of consistency, even if the mean remains unchanged.
Statistical signals are not based on subjective interpretation. They must be defined using established rules, such as control chart run rules, and applied consistently across all datasets. This ensures that detection of process change is systematic, reproducible, and independent of individual judgment.
4. Control Chart Interpretation
Control charts are the primary mechanism for signal detection.
4.1 Out-of-Control Conditions
Typical out-of-control signals include:
- one or more points beyond control limits
- consecutive points on one side of the mean
- trends of increasing or decreasing values
- cyclic or repeating patterns
These conditions indicate that the process may no longer be operating under statistical control.
4.2 Within-Limit Signals
Not all signals occur outside control limits.
Patterns within limits may indicate:
- gradual drift
- systematic bias
- emerging instability
Interpretation must consider both position and pattern of data points.
5. Differentiation of Variation Types
Accurate interpretation requires distinguishing between:
- Common cause variation
inherent variability of a stable process - Special cause variation
identifiable, non-random sources of variation
Only special cause variation requires investigation. Misclassification leads to unnecessary intervention or missed risk.
6. Process Drift
Process drift is a gradual, sustained change in process performance over time.
6.1 Types of Drift
- mean shift
- increase in variability
- gradual loss of centering
- performance degradation
6.2 Detection Methods
Drift is typically detected through:
- trend analysis over multiple batches
- control chart pattern rules
- comparison of current performance to historical baselines
Drift may not immediately result in out-of-specification results but represents increasing risk.
7. Signal Evaluation and Triage
Signal evaluation is the initial decision step that determines whether a detected signal represents true process behavior requiring investigation or a non-meaningful observation.
All signals are not equivalent. Some indicate normal variation or data issues, while others represent loss of control. Triage ensures that response is proportional to risk.
Initial evaluation must address the following:
- Data integrity and correctness
Confirm that the signal is based on valid data. Verify no transcription errors, instrument faults, incorrect sampling, or analytical anomalies. A signal caused by invalid data does not represent process behavior. - Repeatability of the observation
Determine whether the signal is isolated or reproducible. A single point may represent random variation, while repeated occurrences indicate a systematic issue. - Magnitude and persistence of deviation
Evaluate how far the data deviates from expected behavior and whether the deviation is sustained. Small, transient deviations are lower risk than large or persistent shifts. - Proximity to specification limits
Assess how close the observed values are to product specifications. Signals near specification limits represent higher risk even if still within control limits. - Potential impact on product quality
Determine whether the parameter is linked to a Critical Quality Attribute and whether the observed deviation could affect product acceptance.
Based on this evaluation, the signal is classified:
- no action required
- continue monitoring
- initiate formal investigation
This structured triage prevents overreaction to normal variation while ensuring that meaningful signals are escalated and addressed.
8. Investigation Framework
When a signal indicates potential loss of control, a structured investigation must be initiated.
8.1 Data Verification
- confirm data accuracy and completeness
- verify instrument performance and calibration
- review sampling and test methods
8.2 Root Cause Analysis
Evaluate potential sources of variation, including:
- raw materials
- equipment performance
- environmental conditions
- operator actions
- process settings
Use structured methods where appropriate.
8.3 Impact Assessment
Determine whether the signal affects:
- critical quality attributes
- batch acceptance decisions
- process capability
Assess both immediate and potential future impact.
9. Documentation and Decision Logic
All signals and investigations must be documented. Documentation must include:
- description of the signal
- data evaluated
- investigation steps and findings
- root cause or justification if none identified
- impact assessment
- corrective and preventive actions where applicable
Decision logic must be defined to ensure consistent handling of similar signals.
10. Integration with Quality Systems
Signal detection and investigation must integrate with the pharmaceutical quality system.
- significant signals may trigger deviation or CAPA processes
- recurring signals may indicate need for control strategy revision
- trends may support continuous improvement initiatives
Escalation criteria must be predefined and consistently applied.
11. Conclusion
Signal detection, drift identification, and structured investigation transform CPV from data collection into active process control.
By applying consistent statistical rules and disciplined evaluation, the process remains controlled, understood, and capable throughout routine manufacturing.