CPV Monitoring Framework and Statistical Methods
1. Introduction
Continued Process Verification is the mechanism by which process performance is monitored during routine manufacturing to ensure the process remains in a state of control. It converts process knowledge and control strategy into ongoing, data-driven verification.
This stage is not a passive review activity. It is an active monitoring system designed to detect variability, identify emerging risks, and confirm that process capability remains aligned with product quality requirements.
The monitoring framework and statistical methods defined in this section establish how process data is collected, analyzed, and interpreted to support real-time and periodic evaluation of process performance.
2. Role of CPV within the Lifecycle
Continued Process Verification operates as the third stage of process validation and serves as the bridge between process qualification and routine manufacturing.
Within the lifecycle:
- Stage 1 establishes process understanding and defines the control strategy
- Stage 2 confirms process performance under controlled conditions
- Stage 3 verifies that performance is maintained during routine production
CPV ensures that the validated state is not assumed but continuously demonstrated through objective evidence.
3. CPV Monitoring Framework
The CPV monitoring framework defines how process data is systematically collected, evaluated, and reviewed.
3.1 Data Sources
Monitoring must incorporate data that is representative of both process performance and product quality, including:
- Critical Process Parameters (CPPs)
- Critical Quality Attributes (CQAs)
- In-process controls
- Equipment and environmental monitoring data
- Batch record data
- Analytical test results
Data selection must be risk-based and directly linked to the control strategy.
3.2 Sampling Strategy and Frequency
Sampling must be defined to capture variability within and between batches.
Considerations include:
- sampling locations based on worst-case conditions
- sampling timing across process steps
- number of samples required to represent variability
- frequency of data collection based on process risk and variability
Sampling strategies established during Stage 1 and Stage 2 must be maintained or refined based on CPV findings.
3.3 Data Integrity and Reliability
All CPV data must comply with data integrity principles:
- attributable, legible, contemporaneous, original, accurate
- complete, consistent, enduring, and available
Systems generating CPV data must be validated where applicable and include controls such as audit trails, access control, and data review procedures.
3.4 Responsibilities and Review Structure
Responsibilities for CPV must be clearly defined:
- data collection and verification
- statistical evaluation
- periodic review and trending
- escalation of deviations and signals
Review frequency must be defined based on process criticality and manufacturing volume.
4. Statistical Methods and Tools
Statistical methods convert raw process data into meaningful information about process performance and variability.
4.1 Control Charts
Control charts are the primary tool for monitoring process stability over time. They are used to:
- detect shifts and trends
- identify out-of-control conditions
- distinguish between common and special cause variation
Selection of chart type must be based on data characteristics, including variable vs attribute data and sample size.
4.2 Trend Analysis
Trend analysis evaluates data over time to identify gradual changes that may not trigger control chart limits. Applications include:
- long-term process drift
- seasonal or batch-related variability
- performance degradation
Trend analysis complements control charts by providing a broader view of process behavior.
4.3 Process Capability Analysis
Process capability evaluates the ability of the process to consistently produce output within defined specification limits by comparing inherent process variability to allowable tolerance. Common metrics include:
- Cp and Cpk — short-term capability indices based on within-subgroup variation, reflecting the potential capability of a stable process and its centering relative to specification limits
- Pp and Ppk — long-term performance indices based on overall variation, reflecting actual process performance over time, including shifts and drift
Capability analysis provides:
- quantitative assessment of process performance relative to specifications
- evaluation of process centering and spread
- identification of whether variability or process shift is the primary limitation
- objective basis for setting, confirming, or tightening control limits
A capable process demonstrates that variability is sufficiently controlled and centered within specification limits to ensure consistent product quality. Capability must be periodically reassessed during Continued Process Verification to confirm that performance remains acceptable as process conditions, materials, and operational factors evolve.
Process capability is visualized by comparing the distribution of process results to the defined specification limits. The width of the distribution represents process variability, while the position of the mean relative to the limits represents process centering. Both factors determine whether the process can consistently produce acceptable product.
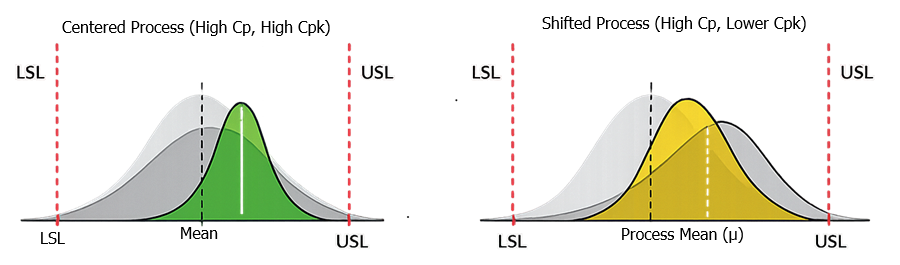
In the centered case, the mean is positioned between Lower Specification Limit (LSL) and Upper Specification Limit (USL) and variability is small relative to the specification range. Both Cp and Cpk are high, indicating a capable and well-centered process.
In the shifted case, variability is similar, but the mean is displaced toward a limit. Cp remains high, but Cpk decreases, indicating increased risk of out-of-specification results.
Process capability requires both controlled variability and proper centering.
4.4 Variability Assessment
Understanding variability is fundamental to CPV. Sources of variability include:
- raw materials
- equipment performance
- environmental conditions
- operator influence
Statistical evaluation must distinguish inherent variability from abnormal variation requiring investigation.
5. Alert and Action Limit Strategy
Alert and action limits define thresholds for detecting potential and actual loss of process control.
5.1 Limit Definitions
- Alert limits indicate early signs of process deviation
- Action limits indicate loss of control requiring investigation
Limits must be established using:
- historical process data
- statistical analysis
- process capability
- risk assessment
5.2 Relationship to Specifications
Control limits are not equivalent to product specifications.
- Specifications define product acceptance
- Control limits define process performance
Control limits must be tighter than specifications to ensure consistent compliance.
5.3 Limit Maintenance and Refinement
Limits must not remain static. They must be:
- periodically reviewed
- adjusted based on new data
- evaluated for continued suitability
Limit changes must be justified, documented, and subject to change control.
6. Integration with Control Strategy
CPV monitoring must directly reflect the defined control strategy.
- CPP monitoring verifies that process inputs remain controlled
- CQA monitoring confirms that product quality is achieved
- Statistical evaluation verifies effectiveness of controls
Any observed gap between monitoring results and expected performance must trigger evaluation of the control strategy.
7. Documentation and Reporting
CPV activities must be documented in a structured and consistent manner.
Documentation typically includes:
- CPV plan or protocol
- statistical analysis reports
- periodic trending reports
- deviation and investigation records
- management review summaries
Reports must provide clear evidence of:
- process stability
- process capability
- effectiveness of controls
8. Conclusion
The CPV monitoring framework and statistical methods establish a structured system for ongoing verification of process performance.
By integrating risk-based data selection, statistically sound analysis, and defined limit strategies, CPV ensures that process control is continuously demonstrated and maintained throughout the product lifecycle.