Design of Experiments and Multivariate Analysis
1. Purpose and Scope
Design of Experiments (DOE) and Multivariate Analysis (MVA) are used to quantitatively evaluate process behavior, identify critical relationships, and establish statistically justified control strategies.
These tools move process understanding from qualitative observation to data-driven decision-making and are applied to:
- identify Critical Process Parameters (CPPs)
- quantify impact on Critical Quality Attributes (CQAs)
- detect interaction effects
- define operating ranges
- support control strategy development
The approach aligns with expectations from FDA and principles defined in ICH Q8 and ICH Q9.
2. Role within Process Validation Lifecycle
DOE and MVA are applied after initial process understanding and risk assessment, and before final control strategy confirmation.
Within the lifecycle:
- process knowledge defines candidate parameters
- risk assessment identifies potentially critical variables
- DOE quantifies parameter effects and interactions
- MVA evaluates multivariate relationships
- results define CPPs and operating ranges
- control strategy is established and justified
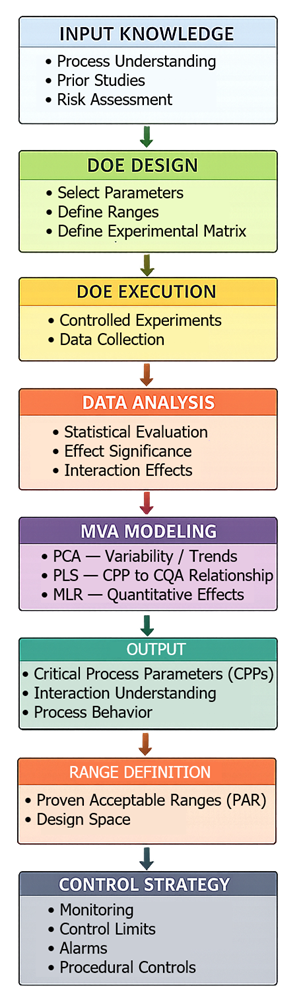
These methods provide the statistical foundation required to transition from development to validated process control. The following diagram shows how DOE and MVA transform process understanding into a defined control strategy.
3. Design of Experiments (DOE)
3.1 Purpose
DOE is a structured statistical approach used to evaluate the effect of multiple process parameters simultaneously under controlled conditions.
3.2 What DOE Determines
DOE enables identification of:
- main effects of individual parameters
- interaction effects between parameters
- non-linear relationships
- relative significance of variables
- parameters impacting CQAs
This supports classification of parameters as critical or non-critical.
3.3 Typical DOE Designs
Common designs include:
- full factorial designs
- fractional factorial designs
- response surface designs
- central composite designs
Selection depends on number of variables, expected interactions, and required resolution.
3.4 Execution Principles
DOE execution must ensure:
- controlled variation of parameters
- risk-based selection of parameter ranges
- reproducible conditions
- adequate number of runs and replicates
- predefined acceptance criteria
All data must meet data integrity expectations, including traceability and controlled recording.
4. Multivariate Analysis (MVA)
4.1 Purpose
MVA evaluates relationships between multiple variables simultaneously and supports interpretation of DOE and process data.
4.2 What MVA Identifies
MVA enables:
- correlation between parameters and CQAs
- identification of interaction effects
- detection of trends and process shifts
- differentiation between signal and noise
- identification of variability sources
4.3 Common MVA Techniques
Multivariate techniques are selected based on analysis objective and data characteristics.
- Principal Component Analysis (PCA)
Used for exploratory analysis. Reduces complex datasets into a small number of components capturing dominant variability.
Identifies trends, batch clustering, and outliers. Does not directly quantify impact on CQAs. - Partial Least Squares (PLS) Regression
Used to model relationships between process parameters and CQAs.
Handles correlated variables and complex datasets. Provides predictive capability and quantifies parameter impact. - Multiple Linear Regression (MLR)
Used for simpler linear relationships between parameters and a response.
Provides interpretable coefficients and statistical significance. Limited when variables are highly correlated or interactions are complex. - Cluster Analysis
Used to group batches or runs based on similarity.
Identifies patterns and abnormal conditions. Does not establish causal relationships.
In practice:
- PCA is used to understand variability and data structure
- PLS or MLR is used to quantify CPP–CQA relationships
- cluster analysis supports trend evaluation and deviation investigations
5. Identification of Critical Process Parameters (CPPs)
DOE and MVA results are used to determine parameter criticality.
A parameter is considered critical when:
- it has statistically significant impact on a CQA
- its variability affects product quality
- it contributes to process instability
Criticality must be supported by statistical evidence and scientific rationale.
6. Interaction Effects and Process Behavior
DOE evaluates whether parameters influence each other.
This allows:
- identification of synergistic or antagonistic effects
- recognition that combined parameter changes may alter outcomes
- understanding of multi-parameter dependency
This prevents incorrect conclusions from isolated parameter evaluation.
7. Establishment of Proven Acceptable Ranges (PAR)
DOE results define ranges where process performance remains acceptable.
These ranges:
- are supported by experimental data
- are linked to acceptable CQA outcomes
- define boundaries of stable operation
PAR establishes the operational limits for routine manufacturing.
8. Design Space
When supported by sufficient data, a design space may be defined as described in ICH Q8.
Design space represents a multidimensional combination of parameters that assures product quality.
Operation within this space:
- provides flexibility
- does not require regulatory post-approval change
Establishment requires strong statistical justification.
9. Link to Control Strategy
DOE and MVA outputs convert process understanding into defined, enforceable control strategy elements. Multivariate modeling establishes a quantitative relationship between process parameters and CQAs, allowing prediction of product quality based on actual operating conditions rather than isolated parameter limits.
The relationship between process parameters and product quality, and its translation into a control strategy, is illustrated below.
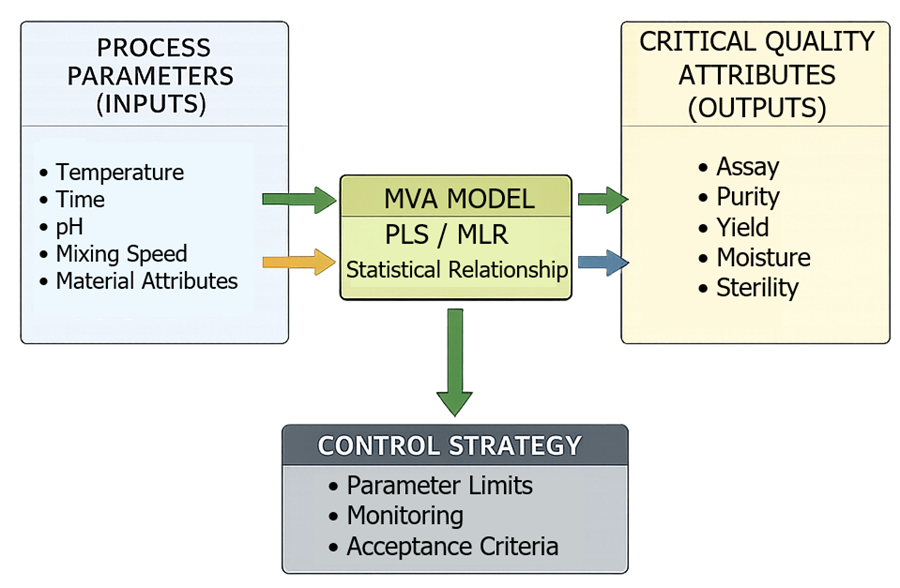
Multivariate models define how variation in one or more parameters impacts CQAs, including interaction effects that cannot be identified through univariate analysis. This enables control decisions to be based on overall process behavior rather than individual parameter thresholds. Based on this relationship, the control strategy is defined as follows:
- Identification of parameters requiring control
Parameters with statistically significant impact on CQAs are designated as CPPs. These parameters must be actively controlled during manufacturing. - Definition of acceptable operating ranges
DOE establishes Proven Acceptable Ranges (PAR) where product quality remains acceptable. These ranges define setpoints and allowable variability. - Establishment of monitoring strategy
Monitoring is defined based on parameter criticality and process sensitivity.
Critical parameters require continuous or high-frequency monitoring, while non-critical parameters are periodically verified. - Definition of alarm and action limits
Limits are derived from the relationship between parameter variation and CQA response.
Alarm limits are set to detect deviation before product quality is impacted, and action limits define when intervention is required. - Selection of control mechanisms
Controls may include automated feedback systems, in-process testing, or procedural controls.
Selection is based on process dynamics, parameter criticality, and risk level. - Consideration of parameter interactions
Control strategy accounts for interaction effects identified during DOE.
Acceptable operation may depend on combinations of parameters rather than individual values. - Support for predictive and real-time control
In advanced applications, multivariate models can be used to predict CQAs in real time, enabling proactive adjustments and reducing reliance on end-product testing.
The resulting control strategy is:
- directly linked to product quality
- statistically justified
- capable of maintaining process performance within validated conditions
This approach aligns with expectations from the FDA and risk-based principles described in ICH Q9.
10. Acceptance Criteria
10.1 DOE Acceptance Criteria
- experimental design is justified
- parameter ranges are risk-based
- sufficient data is generated
- statistical significance is demonstrated
- conclusions are supported by data
10.2 MVA Acceptance Criteria
- method selection is appropriate
- data quality is verified
- model assumptions are met
- results are reproducible
- conclusions align with observed data
10.3 CPP and Range Justification
- CPP identification is statistically supported
- interaction effects are evaluated
- operating ranges are justified by data
- linkage to CQAs is demonstrated
11. Limitations
DOE and MVA:
- require statistical expertise
- depend on data quality
- may not capture all real-world variability
- are limited to studied parameter ranges
Improper design or interpretation leads to incorrect conclusions.
12. Integration with Continued Process Verification
DOE and MVA support lifecycle process validation by enabling:
- ongoing monitoring
- trend analysis
- detection of process drift
- re-evaluation of control strategy
This aligns with continued process verification expectations from the FDA.
13. Summary
DOE and MVA provide the quantitative basis to:
- identify critical parameters
- understand process behavior
- define operating ranges
- establish control strategies
They convert process knowledge into statistically supported evidence required for validation and lifecycle management.