Acceptance Criteria and Statistical Evaluation
1. Purpose and Scope
This article defines how acceptance criteria and statistical evaluation are established and applied during PPQ to determine whether process performance is acceptable. Focus:
- how acceptance criteria are defined and justified
- how statistical methods are selected and applied
- how data is evaluated to support PPQ conclusions
- how variability and consistency are assessed
2. Role within PPQ
Acceptance criteria define what constitutes success.
Statistical evaluation provides the evidence supporting that determination. Within PPQ:
- acceptance criteria are predefined before execution
- data is evaluated against these criteria
- statistical analysis supports conclusions on consistency and control
PPQ is successful only when both criteria and supporting data are met.
3. Definition of Acceptance Criteria
Acceptance criteria must be:
- predefined in the protocol
- based on CQAs and process requirements
- scientifically justified
They must define acceptable performance for:
- product quality
- process parameters
- overall process consistency
4. Types of Acceptance Criteria
4.1 CQA Acceptance Criteria
All Critical Quality Attributes (CQAs) must meet established specifications. Requirements:
- all test results within specification limits
- no unexplained variability
- no trends toward specification limits
4.2 CPP Acceptance Criteria
Critical Process Parameters (CPPs) must:
- remain within defined operating ranges
- demonstrate controlled variability
- show consistent behavior across batches
4.3 Process Consistency Criteria
The process must demonstrate:
- reproducibility across PPQ batches
- stable and predictable variability
- absence of unexplained differences between batches
4.4 Integrated Acceptance Criteria
Acceptance must consider the process as a whole:
- CPP control results in acceptable CQAs
- no conflicting data between parameters and product quality
- control strategy is effective
5. Statistical Evaluation
Statistical evaluation is used to demonstrate that process performance during PPQ is consistent, controlled, and capable of meeting predefined acceptance criteria. The objective is not only to summarize data, but to confirm that observed variability is acceptable and aligned with process understanding.
Selection of statistical methods must consider:
- data type (continuous vs discrete)
- sample size
- process complexity
- level of variability
Statistical analysis must support conclusions regarding:
- stability within batches
- reproducibility across batches
- relationship between CPPs and CQAs
Statistical methods provide evidence but must be interpreted in the context of engineering and process knowledge.
6. Statistical Methods
6.1 Descriptive Statistics
Descriptive statistics are the foundation of PPQ evaluation.
They are used to:
- quantify central tendency (mean)
- quantify variability (standard deviation, range)
- identify spread and distribution of data
Application in PPQ:
- evaluate consistency of CPPs within and across batches
- assess variability of CQAs relative to specification limits
- identify outliers or unexpected values
Interpretation:
- low variability relative to limits indicates stable process
- large spread or inconsistent values may indicate lack of control
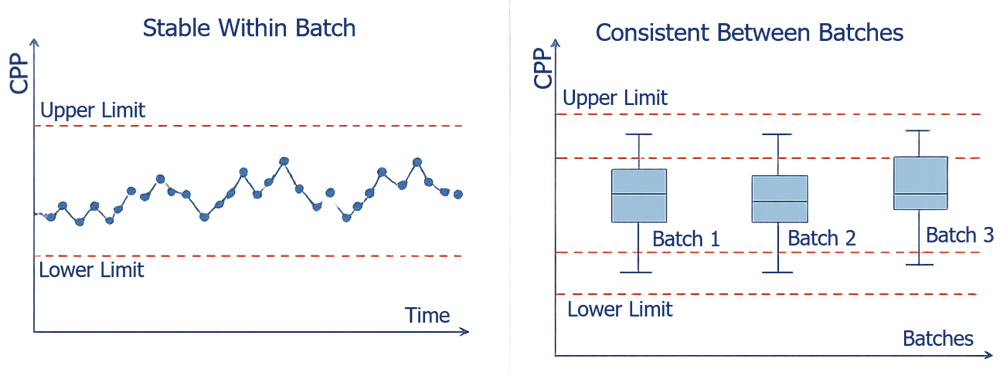
6.2 Within-Batch Analysis
Within-batch analysis evaluates process stability over time and location. Statistical evaluation must distinguish between variability within a batch and variability between batches.
Methods include:
- time-based plots of CPPs
- comparison of samples from different batch locations
- evaluation of variation across process stages
Application:
- confirm absence of drift or instability
- verify uniformity across the batch
- detect stage-specific variability
Interpretation:
- stable profiles indicate controlled process
- trends, spikes, or shifts indicate potential instability
6.3 Between-Batch Comparison
Between-batch analysis evaluates reproducibility of process performance.
Methods include:
- comparison of batch means and variability
- graphical comparison of CPP profiles
- comparison of CQA distributions across batches
Application:
- confirm consistent process behavior
- identify batch-to-batch variation
Interpretation:
- similar results across batches indicate reproducibility
- significant differences require investigation and justification
6.4 Trend Evaluation
Trend analysis evaluates systematic patterns in data.
Methods include:
- plotting CPPs and CQAs in sequence
- identifying upward or downward trends
- detecting gradual drift
Application:
- detect early signs of process instability
- evaluate consistency across processing stages
Interpretation:
- absence of trend indicates stable process
- consistent drift may indicate loss of control or inadequate control strategy
6.5 Process Capability (Where Applicable)
Process capability analysis evaluates the ability of the process to consistently meet specification limits.
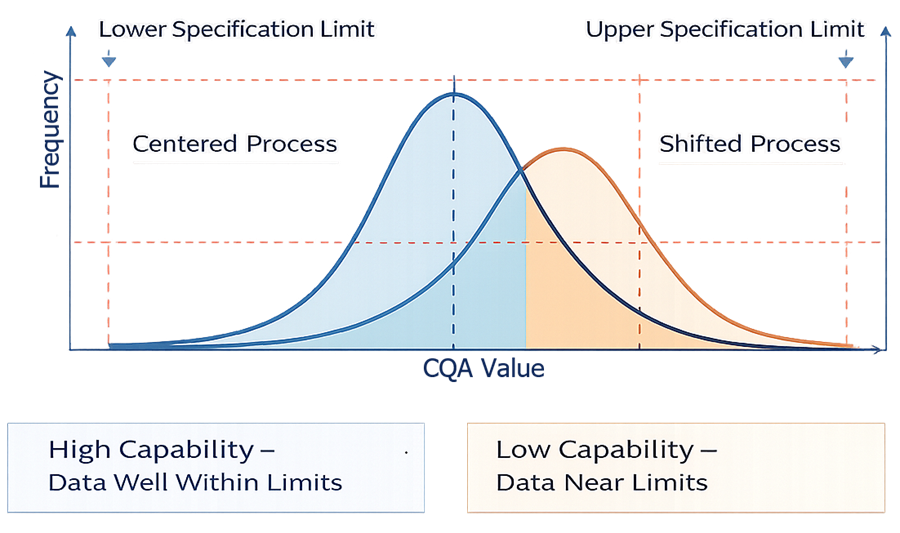
Common indices:
- Cp — potential capability
- Cpk — actual capability considering process centering
Application:
- assess margin between process performance and specification limits
- determine robustness of process
Interpretation:
- higher capability indicates greater confidence in consistent performance
- low capability indicates risk of specification failure
Use limitations:
- requires sufficient data
- assumes stable process and appropriate data distribution
7. Interpretation of Results
Statistical results must be interpreted in the context of process performance and validation objectives.
Evaluation must demonstrate:
- compliance with acceptance criteria
All CQAs meet specification limits - controlled variability
Variability is consistent and within expected limits - process stability
No evidence of drift, instability, or uncontrolled variation - reproducibility
Consistent performance across PPQ batches
Statistical significance alone is not sufficient. Results must also be:
- scientifically plausible
- consistent with process understanding
- supported by observed process behavior
Marginal results, even if within specification, require evaluation of:
- proximity to limits
- consistency across batches
- potential impact on long-term process performance
The objective is to confirm that the process is not only compliant, but robust and reliable under routine variability.
8. Handling of Marginal Results
Results approaching specification limits require evaluation.
Considerations:
- consistency across batches
- proximity to limits
- potential risk to product quality
Marginal performance may indicate insufficient process capability.
9. Documentation and Justification
All conclusions must be:
- documented
- supported by data
- scientifically justified
Traceability must be maintained:
CPP → data → analysis → conclusion
10. Acceptance Decision
PPQ is acceptable when:
- all CQAs meet specifications
- CPPs remain within limits
- process is consistent across batches
- statistical evaluation supports stability
Failure to meet criteria requires investigation and potential requalification.
11. Summary
Acceptance criteria and statistical evaluation provide the basis for PPQ decisions.
They ensure that:
- process performance is objectively evaluated
- conclusions are supported by data
- process is capable and controlled
They represent the final decision layer of PPQ.