Sampling Strategy and Statistical Methodology
1. Purpose
Sampling strategy and statistical methodology define how process and product data are collected and evaluated to demonstrate and maintain process control. They establish how data represent the process, how variability is quantified, and how decisions are made regarding process performance and product quality.
2. Role Within Process Validation
Sampling and statistical evaluation support all stages of the lifecycle. They ensure that conclusions about process performance are based on representative and scientifically justified data. Application across lifecycle:
- Process Design
- development studies
- characterization of variability
- Process Performance Qualification
- confirmation of process consistency
- demonstration of control under commercial conditions
- Continued Process Verification
- ongoing monitoring
- detection of trends and shifts
3. Sampling Strategy Design
Sampling strategy defines how, where, and when data are collected. It must ensure that collected data represent the full range of process conditions and variability. Key elements:
- sampling locations
- defined points within the process
- worst-case and representative positions
- sampling frequency
- based on process variability and risk
- sufficient to detect changes
- sample size
- statistically justified
- aligned with variability and confidence requirements
- timing of sampling
- critical process stages
- steady-state and transient conditions
Sampling must be designed to detect both:
- random variability
- systematic variation or trends
4. Statistical Methodology
Statistical methods define how collected data are analyzed and interpreted. Method selection must align with data type, process behavior, and the specific decision being made. The objective is correct interpretation of process behavior and risk.
4.1 Descriptive Statistics
Used for: initial data evaluation, PPQ summary, routine reporting Purpose: quantify central tendency and variability
Key measures:
- Mean
- average value of the dataset
- indicates central process level
- Standard Deviation
- measure of variability around the mean
- indicates process consistency
- Range
- difference between minimum and maximum
- simple indicator of spread
Application:
- early assessment of process performance
- comparison between batches
- baseline characterization
Limitation:
- does not detect trends or time-dependent behavior
4.2 Control Charts
Used for: ongoing monitoring during PPQ and CPV.
Purpose: evaluate process stability over time.
Typical types:
- Individuals chart (I-chart) for continuous data
- X-bar and R chart for subgroup data
What it detects:
- shifts in process mean
- increasing variability
- non-random patterns
Key concept:
- distinguishes common cause variation from special cause variation
Application:
- real-time monitoring of CPPs
- trending of CQAs
- early detection of loss of control
4.3 Process Capability Analysis
Used for: assessing ability to meet specifications after stability is demonstrated.
Purpose: determine whether process output fits within specification limits
Key indices:
- Cp
- potential capability assuming centered process
- Cpk
- actual capability accounting for process centering
Interpretation:
- Cp or Cpk ≥ 1.33 typically acceptable
- low Cpk indicates centering or variability issue
Application:
- PPQ conclusion
- CPV periodic evaluation
- justification of control limits
Limitation:
- requires stable process
- invalid if process is not in statistical control
4.4 Trend Analysis
Used for: medium- to long-term evaluation during CPV
Purpose: detect gradual changes not visible in single-batch analysis
What it detects:
- drift over time
- seasonal or cyclic patterns
- slow degradation of performance
Application:
- evaluation of CPP drift
- stability of CQAs over campaigns
- early signal before control limits are exceeded
Methods may include:
- moving averages
- regression analysis
4.5 Hypothesis Testing
Used for: comparison and decision-making when changes occur
Purpose: determine whether observed differences are statistically significant
Typical applications:
- before vs after process change
- comparison of equipment or materials
- evaluation of deviation impact
Examples:
- t-test for comparing means
- ANOVA for multiple groups
Key concept:
- distinguishes real change from random variation
Limitation:
- requires defined assumptions
- must be interpreted in context of process risk
Hypothesis testing is applied when a defined comparison or decision is required. It is not used for routine monitoring but is triggered by changes, deviations, or the need to evaluate differences between conditions. It supports scientifically justified decisions by distinguishing real process changes from random variability.
4.6 Method Selection Summary
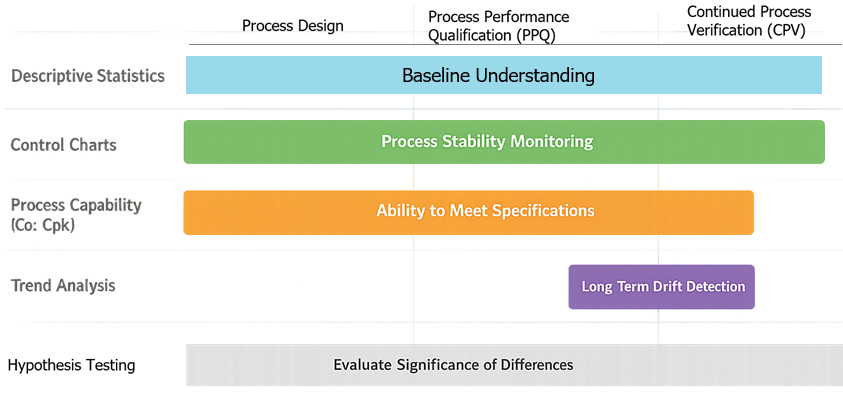
- Descriptive statistics
- baseline understanding and reporting
- Control charts
- real-time monitoring and stability assessment
- Capability analysis
- ability to meet specifications
- Trend analysis
- long-term performance monitoring
- Hypothesis testing
- evaluation of changes and differences
All methods must be applied with understanding of process behavior, not as isolated calculations.
5. Integration with Control Strategy
Sampling and statistical evaluation are part of the control strategy, not separate activities. They support:
- verification that CPPs remain within limits
- confirmation that CQAs meet specifications
- evaluation of control effectiveness
Sampling points and statistical methods must align with:
- defined CPPs
- defined CQAs
- identified risks
6. Application During PPQ
During PPQ, sampling and statistical analysis demonstrate process consistency and control. Activities:
- collection of data across multiple batches
- evaluation of variability between and within batches
- confirmation of parameter stability
- demonstration that CQAs meet acceptance criteria
Sampling must be sufficient to support statistical confidence in process performance.
7. Application During Continued Process Verification
During routine manufacturing, sampling and statistical methods support ongoing monitoring. Activities:
- routine data collection from batches
- statistical trending of CPPs and CQAs
- detection of shifts, trends, or increased variability
- evaluation of process capability over time
Sampling frequency and data evaluation must be adjusted based on process knowledge and risk.
8. Handling of Variability and Outliers
Statistical evaluation must distinguish between normal variability and abnormal conditions. Requirements:
- defined criteria for identifying outliers
- investigation of unexplained results
- prevention of unjustified data exclusion
All data handling must preserve data integrity and traceability.
9. Change Management and Adaptation
Sampling strategy and statistical methods must be updated as process understanding evolves. Triggers:
- process changes
- equipment or material changes
- observed trends or variability
- deviations or investigations
Changes must be:
- justified using data and risk assessment
- implemented through change control
- verified for effectiveness
10. Documentation and Traceability
Sampling strategy and statistical methodology must be clearly documented. Documentation includes:
- sampling locations, frequency, and rationale
- sample size justification
- selected statistical methods
- acceptance criteria and decision rules
Traceability must demonstrate:
- linkage to process understanding and risk assessment
- support of PPQ conclusions
- ongoing verification during routine manufacturing
This ensures that data collection and analysis are scientifically justified, consistent, and inspection-ready.