

Continued Process Verification (CPV) Program and Monitoring Strategy
Continued Process Verification (CPV) is Stage 3 of the process-validation lifecycle and provides ongoing assurance that a commercial manufacturing process remains in a state of control after Process Performance Qualification (PPQ). Unlike PPQ, which evaluates the process during a defined qualification period, CPV operates throughout routine commercial manufacturing and continuously expands the evidence available about process variability, control-strategy effectiveness, material effects, equipment behavior, and product quality.
FDA’s Process Validation: General Principles and Practices defines the Stage 3 objective as continued assurance that the process remains in the validated state during commercial manufacture. FDA expects an ongoing system for collecting and analyzing product and process data, detecting undesirable variability, identifying problems, and determining when corrective, preventive, or improvement actions are necessary.
CPV should therefore be designed as a decision-making system, not merely a collection of trend charts prepared periodically for review. It connects routine manufacturing information with statistical analysis, process knowledge, deviation investigation, change management, and formal state-of-control assessment. The broader principles established during General Principles of Process Validation continue through CPV, while the detailed reporting and state-of-control decision are addressed separately in Continued Process Verification Reporting and State-of-Control Assessment.
CPV Begins With the PPQ Conclusion
The initial CPV program should be defined before PPQ is formally closed. The PPQ report provides the starting understanding of commercial variability, identifies parameters and attributes requiring ongoing attention, documents residual uncertainty, and establishes follow-up commitments or heightened monitoring where necessary.
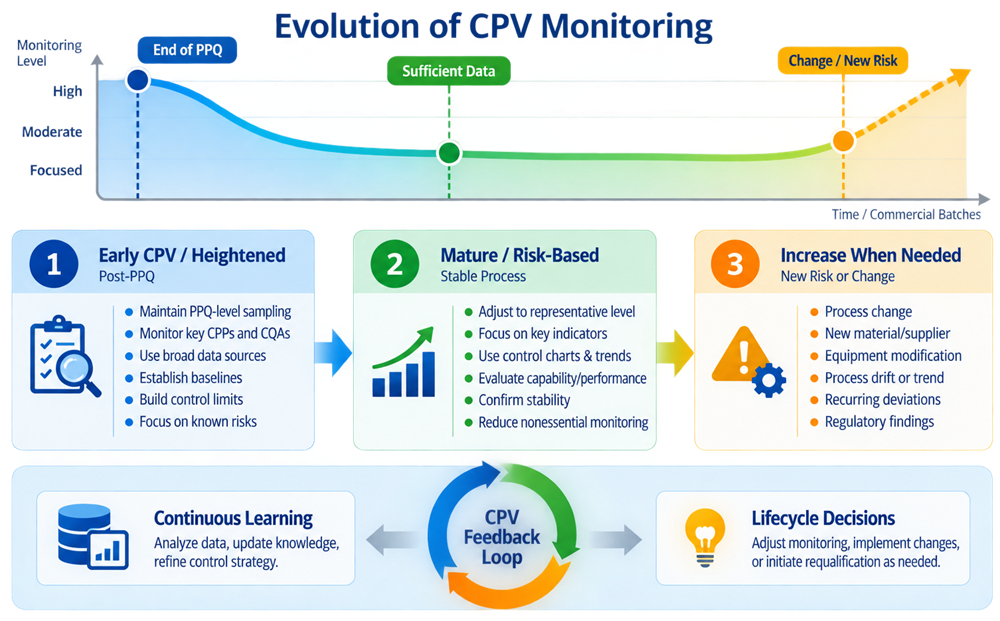
FDA specifically recommends continuing process-parameter and quality-attribute monitoring at the level used during Process Qualification until sufficient commercial data exist to generate meaningful estimates of variability. Only then should routine monitoring be adjusted to a statistically appropriate and representative level. Process variability should subsequently be reassessed periodically, with monitoring modified when warranted.
This creates a logical lifecycle progression: PPQ → Heightened Early CPV → Accumulated Commercial Evidence → Mature Risk-Based Monitoring
The transition should be evidence-driven rather than calendar-driven. Completion of ten batches, six months of production, or another arbitrary milestone does not by itself justify reducing monitoring.
The CPV Plan
A formal CPV plan should define how ongoing process performance will be evaluated and how statistical signals will be converted into quality decisions. The level of formality can vary with product risk, process complexity, manufacturing frequency, and the maturity of process knowledge, but the plan should be sufficiently explicit that different reviewers would reach consistent interpretations of the same data.
A practical CPV plan normally defines:
- products and processes within scope;
- monitored parameters and attributes;
- data sources and ownership;
- sampling frequency and stratification;
- statistical methods;
- initial baselines and control limits where appropriate;
- alert and escalation criteria;
- treatment of atypical data;
- review frequency;
- responsibilities for analysis and Quality Unit oversight;
- investigation interfaces;
- reporting requirements;
- change-control interfaces; and
- criteria for revising the monitoring strategy.
The plan should trace back to the control strategy developed during Process Control Strategy and Design Space Development and verified under commercial conditions during Verification of CPPs and Process Control Strategy During PPQ.
What Should Be Monitored
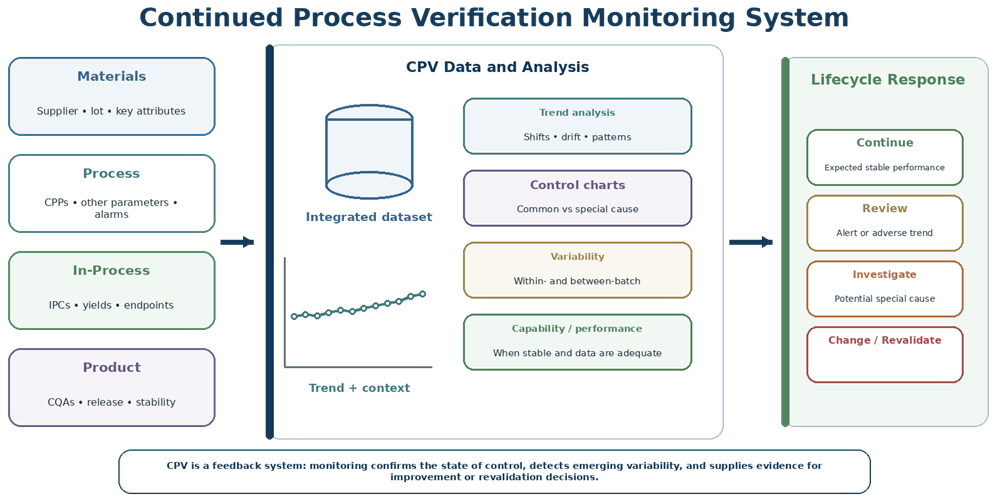
CPV should monitor variables that provide meaningful evidence about process performance and product quality. This includes Critical Process Parameters (CPPs) and Critical Quality Attributes (CQAs), but a useful CPV program should not be limited only to formally designated “critical” variables.
Some noncritical parameters can be valuable leading indicators of process deterioration. Examples include process duration, adjustment frequency, equipment loading, alarm frequency, yield, reject rate, controller output, or an intermediate response that changes before a CQA is affected. Conversely, monitoring every available data tag simply because a historian can collect it creates large datasets without necessarily improving process understanding.
ICH Q10’s Process Performance and Product Quality Monitoring System similarly calls for monitoring parameters and attributes identified through the control strategy, using suitable measurement and statistical tools to verify continued operation within a state of control and identify sources of variation.
CPV Data Sources
The CPV dataset should extend beyond CPP and finished-product results. FDA specifically identifies process trends and the quality of incoming materials or components, in-process material, and finished products as relevant Stage 3 data and recommends review of additional information capable of identifying variation.
Useful CPV data sources can include:
| Data source | Examples |
|---|---|
| Incoming materials | Supplier, lot, particle size, moisture, potency, viscosity, bioburden |
| Process parameters | CPPs, setpoints, actual values, process time, flow, pressure, temperature |
| Automation | Controller output, alarms, interlocks, overrides, process-state transitions |
| In-process controls | Weight, pH, concentration, moisture, uniformity, endpoints |
| Product quality | CQAs, release data, impurities, dissolution, potency, microbiological data |
| Process performance | Yield, cycle time, reject rate, rework, hold duration |
| Equipment / systems | Maintenance, calibration, failures, sensor replacement |
| Quality events | Deviations, OOS, OOT, CAPA, recurring interventions |
| External feedback | Complaints, returns, recalls, stability observations where relevant |
ICH Q10 also expects the monitoring system to incorporate internal and external feedback such as complaints, product rejections, nonconformances, recalls, deviations, audits, and regulatory findings.
These sources do not all need the same review frequency or statistical treatment. The CPV plan should identify which information is reviewed continuously, per batch, monthly, quarterly, annually, or through another risk-based schedule.
Data Context and Stratification
A CPV dataset becomes much more informative when results remain connected to manufacturing context. Parameter or CQA data should be attributable, where relevant, to batch, material lot, equipment train, line, filling head, shift, campaign, operator group, season, process stage, and other factors capable of explaining variation.
Pooling all data into one overall trend can conceal localized deterioration. For example, a process may appear stable overall while one equipment train shows progressively higher variability, one supplier lot consistently shifts a process response, or the end of long manufacturing campaigns exhibits greater reject rates.
Stratification should therefore continue beyond PPQ when Stage 3 data indicate that meaningful subgroups exist. The CPV plan can evolve as commercial knowledge reveals which groupings are useful and which no longer add value.
Intra-Batch Variability
FDA specifically identifies scrutiny of both intra-batch and inter-batch variation as part of a comprehensive CPV program. Intra-batch evaluation determines whether process behavior remains consistent within individual batches and can detect time-, location-, or sequence-related effects.
Depending on the process, useful comparisons can include beginning/middle/end, top/middle/bottom, filling positions, equipment zones, pre/post-hold conditions, or process trajectories over time. As the process matures, not every original PPQ sampling point necessarily needs to be retained, but any reduction should be supported by evidence demonstrating that the reduced strategy remains representative.
Inter-Batch Variability
Inter-batch evaluation asks whether the process remains reproducible over routine commercial manufacture. Useful comparisons include batch means, variability, parameter profiles, CQA distributions, yields, material attributes, process durations, adjustments, and deviations.
A process can produce every batch within specification while still developing an adverse batch-to-batch trend. Increasing variability, progressive movement of the mean, greater dependence on manual adjustment, or growing sensitivity to raw-material variation may indicate deterioration long before a specification failure occurs.
This distinction is central to CPV: specification compliance is an outcome; state of control is a broader process-performance conclusion.
Descriptive Statistics
Descriptive statistics provide the foundation of CPV analysis. Depending on the data, these can include mean, median, standard deviation, range, interquartile range, percentiles, minimum/maximum values, coefficient of variation where meaningful, defect rates, and frequency measures.
Statistics should be accompanied by graphical review because trends and subgroup behavior are often easier to recognize visually. Run charts, histograms, box plots, scatter plots, batch profiles, and stratified comparisons can reveal behavior that a summary table obscures.
The objective is not to maximize statistical complexity but to answer whether process behavior remains stable, predictable, and consistent with the current process model.
Control Charts
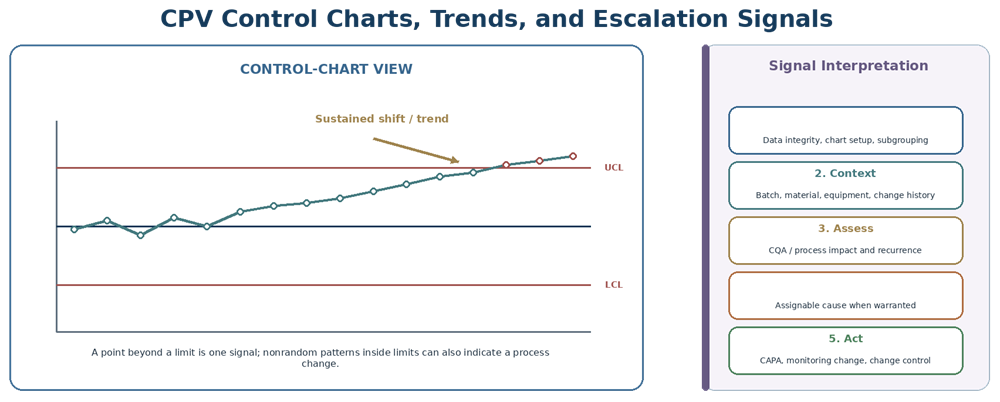
Control charts are among the most useful CPV tools when data structure and collection frequency support them. NIST’s Control Chart guidance describes a control chart as a time-ordered display containing a center line and upper and lower control limits representing expected behavior of an in-control process.
Chart type should match the data. Depending on the process, CPV may use Individuals/Moving Range charts, X-bar and R or S charts, attribute charts, CUSUM, EWMA, or multivariate approaches. NIST also identifies Shewhart, CUSUM, EWMA, and multivariate charts as established statistical process-control techniques.
A control chart should not be treated as a mechanical “point outside the line equals failure” tool. A process can show a meaningful shift, run, trend, cycle, or other nonrandom pattern even when all points remain within the control limits. NIST specifically notes that values within limits do not automatically establish control if the sequence itself shows systematic behavior.
Control Limits and Specification Limits Are Different
Statistical control limits and specifications serve different purposes. Specification limits define acceptable product, material, or process requirements; control limits describe the expected statistical behavior of a monitored process.
A process may therefore be statistically stable while operating too close to a specification boundary, making long-term capability inadequate. Conversely, every result may remain within specification while a control chart indicates a statistically meaningful shift or trend that requires investigation.
Control limits should be based on an appropriate dataset and process state rather than copied from specifications or selected merely because they appear sufficiently narrow. Early CPV limits may need refinement as the amount and representativeness of commercial data increase.
Alert and Action Criteria
FDA’s Stage 3 discussion states that process design and development should establish appropriate detection and mitigation strategies as well as appropriate alert and action limits, while recognizing that commercial manufacturing may reveal sources of variation not encountered previously.
Alert criteria are useful for identifying conditions that deserve review before a formal loss of control occurs. Action criteria should trigger a defined response when the evidence indicates a more significant process concern. The exact terminology is site-specific, but the decision logic should be clear enough to prevent inconsistent interpretation.
An alert does not necessarily mean a deviation has occurred, and an action signal does not automatically mean the product is unacceptable. CPV signals initiate scientific assessment of the process condition, its cause, and its potential quality significance.
Trend Analysis
Trend analysis complements formal control charts by evaluating gradual movement over time. This is particularly useful for processes showing slow equipment wear, material shifts, seasonal effects, changing process duration, progressive calibration bias, or gradual movement toward a control or specification boundary.
Trend evaluation can include graphical review, regression, moving averages, CUSUM, EWMA, or other methods appropriate to the signal being sought. The statistical technique should match the expected type of change and the data-generation frequency rather than being standardized across all CPV variables.
For more detailed treatment of signal investigation, adverse trends, and process drift, see Process Drift, Statistical Signals, and CPV Investigation.
Common-Cause and Special-Cause Variation
A stable process displays a reasonably predictable pattern of common-cause variation generated by the process as currently designed and operated. Special-cause variation represents an additional source that changes process behavior and may result from equipment malfunction, material differences, maintenance, operator action, environmental influence, process change, or another identifiable event.
The purpose of CPV is not to eliminate all variation. It is to understand which variation is expected, detect when the process behaves differently from that expectation, and determine whether the difference has quality or control significance.
Reacting unnecessarily to normal common-cause variation can actually increase process instability. Conversely, treating every statistically significant signal as harmless “normal variation” can allow process deterioration to continue.
Capability and Performance Analysis
Process capability compares the distribution of a stable process with specification limits. NIST notes that capability assessment is meaningful when the process is sufficiently stable and the available data adequately characterize its variation.
Indices such as Cp and Cpk, or Pp and Ppk where appropriately defined, can support CPV but should not become universal acceptance criteria. Their usefulness depends on process stability, distribution, subgrouping, sample size, independence, and specification structure. A single Cpk number should never replace examination of trends, shifts, material effects, deviations, or other process evidence.
CPV is often the appropriate lifecycle stage for capability assessment because substantially more commercial data are available than during PPQ. Even then, a universal threshold such as Cpk ≥ 1.33 should not be presented as an FDA requirement; internal criteria should be justified for the specific product, process, attribute, and risk.
Distribution Assumptions
Statistical methods should reflect the underlying data. Normal-distribution methods may be reasonable for some continuous process variables, while microbial counts, defect rates, bounded percentages, impurity values near reporting limits, or multimodal populations can require different treatment.
Distribution assumptions should be periodically reconsidered because the apparent distribution can change as more commercial data accumulate. A statistical approach selected during early CPV should not remain frozen if later evidence shows that its assumptions are inappropriate.
This issue is discussed more broadly in Sampling and Statistical Strategy for Process Validation and PPQ Acceptance Criteria and Statistical Evaluation.
Multivariate Analysis
Some manufacturing processes involve interactions among multiple parameters and material attributes that cannot be interpreted adequately using independent univariate trends. Multivariate analysis, principal-component methods, partial least-squares models, or other models may be appropriate when scientifically justified and supported by sufficient data.
These methods can identify relationships and unusual combinations of variables that would not trigger individual univariate alarms. However, model complexity should remain proportionate to the process problem being solved, and model maintenance, data preprocessing, assumptions, version control, and interpretation should be governed throughout the lifecycle.
A multivariate model used in CPV becomes part of the monitoring system and should be evaluated when the process, equipment, analytical method, material population, or underlying data distribution changes.
Review Frequency
There is no universal FDA requirement that every CPV variable be formally reviewed monthly, quarterly, or at another single frequency. Review frequency should reflect product risk, manufacturing volume, data frequency, process maturity, historical variability, and the ability of a delayed review to affect product quality.
FDA recommends that the Quality Unit meet periodically with production personnel to evaluate process data, discuss trends or undesirable variability, and coordinate corrective or follow-up actions. High-volume or high-risk processes may require automated or near-real-time signal review, while low-frequency manufacturing may require batch-by-batch evaluation supplemented by broader periodic analysis.
The frequency should be documented in the CPV plan and reconsidered when the process changes.
CPV Is Not the Same as Annual Product Review
21 CFR 211.180(e) requires written records to be maintained so that product-quality standards can be evaluated at least annually, including review of representative batches and relevant complaints, recalls, returns, and investigations.
That annual evaluation does not replace CPV. A signal indicating deteriorating process control should not wait until the next Annual Product Review (APR) or Product Quality Review (PQR) before being evaluated. CPV should be sufficiently timely to detect undesirable variation and trigger action while the information remains operationally useful.
The APR/PQR and CPV may use overlapping datasets, but their purposes differ: the annual review is a broader periodic GMP review, while CPV specifically provides ongoing assurance of process performance and state of control.
Alert and Escalation Logic
A well-designed CPV program should define what happens when a signal appears. A useful logic is:
Signal detected → Verify data and method → Review manufacturing context → Assess process/product impact → Determine investigation requirement → Implement action → Verify effectiveness → Update process knowledge
The first response should generally be verification rather than immediate process adjustment. Incorrect chart configuration, data-transcription error, inappropriate subgrouping, a known material change, maintenance activity, or another legitimate context can explain a signal without representing uncontrolled manufacturing.
Where the signal remains unexplained or indicates a credible special cause, it should transition into the appropriate deviation, investigation, CAPA, change-control, or validation process. The detailed investigation approach belongs in Process Drift, Statistical Signals, and CPV Investigation.
OOS, OOT, Deviations, and Complaints as CPV Signals
FDA specifically identifies defect complaints, OOS results, process deviations, yield variation, batch records, raw-material records, and adverse-event information as potential sources of Stage 3 variation signals. These events should not exist in isolated quality systems with no connection to CPV.
A recurring deviation category, rising complaint frequency, repeated OOT result, or increasing reject rate can be more meaningful than any single event. CPV should therefore evaluate both individual investigations and the aggregate pattern of events.
Where the pattern suggests a loss or deterioration of process control, formal escalation should occur even when individual investigations were previously closed.
Changes and CPV
CPV data can identify opportunities to improve operating ranges, setpoints, material controls, in-process controls, equipment settings, or other elements of the control strategy. FDA recognizes that Stage 3 data may support such optimization but expects changes to be justified, planned, documented, and approved before implementation; depending on product impact, additional process-design or qualification activity may be warranted.
The monitoring system should also assess the effect of changes after implementation. A change that appears successful during initial testing may introduce a slower shift in variability or another secondary effect that becomes visible only through continued commercial monitoring.
See Process Change Control, Revalidation, and Lifecycle Management for the broader decision framework.
CPV Monitoring Should Evolve
The CPV plan should not remain permanently identical to the plan established immediately after PPQ. FDA specifically recommends adjusting monitoring when sufficient variability data become available and periodically reassessing variability thereafter.
Monitoring may be reduced when accumulated evidence demonstrates stable, well-understood behavior and the revised plan remains representative. It may also be increased again when process drift, material change, equipment modification, new supplier, scale change, recurring deviation, CAPA, or other lifecycle event increases uncertainty.
The principle is therefore not “monitor less as the process ages.” The principle is monitor according to current process knowledge and risk.
CPV Reporting
Routine CPV analysis should be documented in a form appropriate to the process and frequency of manufacture. Some processes may use automated dashboards with documented periodic review; others may require monthly, quarterly, campaign-based, or batch-based reports. The reporting mechanism should identify meaningful signals, investigations, process changes, emerging risks, and unresolved issues rather than merely reproducing large tables of data.
A periodic CPV report should normally integrate process performance, CQA results, material effects, control charts or other statistical trends, capability or performance analysis where meaningful, deviations, OOS/OOT observations, changes, CAPA effectiveness, and conclusions about the current control strategy.
The formal integration of those data into a documented state-of-control conclusion is addressed in Continued Process Verification Reporting and State-of-Control Assessment.
Management and Quality Review
ICH Q10 places management review of process performance and product quality within the pharmaceutical quality system and expects monitoring outputs to support continual improvement. CPV results should therefore be visible to functions responsible for manufacturing, process engineering, Quality, technical operations, statistics, and product lifecycle management.
Management review should focus on meaningful conclusions rather than the volume of data collected. Appropriate questions include whether variability is changing, whether the control strategy remains effective, whether recurring deviations indicate broader weakness, whether monitoring remains appropriately designed, and whether new information requires a change in process or validation strategy.
CPV and State of Control
A state-of-control conclusion cannot be based solely on the absence of OOS results. The complete evidence should demonstrate that process behavior remains predictable, variability is understood and appropriately controlled, the control strategy continues to perform as intended, CQAs remain adequately protected, and observed changes are understood.
FDA’s Stage 3 model specifically emphasizes systems capable of detecting unplanned departures and undesirable variability so corrective, anticipatory, or preventive action can be taken before the validated state is lost.
This distinction is important because a process can continue producing conforming product while showing early evidence of deteriorating control. CPV should detect those signals early enough for the organization to respond before specification failure becomes the primary indicator of a problem.
CPV and Continued Improvement
CPV is not intended only to defend the original validated state. Accumulated commercial data can deepen process understanding, reveal unnecessary controls, identify opportunities to improve operating margin, support more representative monitoring, or justify improvements in equipment, materials, or process design.
ICH Q10 specifically describes the monitoring system as a source of knowledge that can increase process understanding and support continual improvement. Such improvements should remain within formal change management, with validation impact assessed according to the significance of the proposed change.
The result is a closed lifecycle loop: Stage 1 knowledge → PPQ confirmation → CPV monitoring → New knowledge → Change / improvement → Verification → Updated CPV
Key Principles
- CPV is Stage 3 of the FDA process-validation lifecycle and provides ongoing assurance that the process remains in a state of control.
- CPV should function as a monitoring and decision system, not merely a periodic charting exercise.
- The initial CPV plan should originate from PPQ conclusions, known variability, control-strategy requirements, and residual uncertainty.
- FDA recommends retaining heightened PPQ-level monitoring until sufficient data support meaningful variability estimates and representative routine monitoring.
- CPV should examine both intra-batch and inter-batch variation.
- Monitoring should include relevant materials, process parameters, in-process data, CQAs, process responses, quality events, and other indicators of variation.
- Control charts distinguish expected and potentially special-cause variation, but points within limits can still show adverse nonrandom patterns.
- Statistical control limits and specification limits are not interchangeable.
- Capability analysis should be applied only when the process and dataset support meaningful interpretation.
- There is no universal FDA CPV review frequency; review should be sufficiently timely and proportionate to risk and data generation.
- Annual product review requirements under 21 CFR 211.180(e) do not substitute for ongoing CPV.
- Alert and escalation logic should convert statistical or operational signals into defined scientific review and investigation.
- CPV monitoring should evolve as knowledge increases and should expand again when change or new variability increases uncertainty.
- Stage 3 data should feed change control, CAPA, process improvement, revalidation decisions, and formal state-of-control assessment.