

Analytical Sensitivity and Quantitation Limits in Cleaning Validation
Analytical methods used for cleaning validation must be capable of detecting and, when required, quantifying residues at concentrations relevant to the established cleaning acceptance criteria. Analytical sensitivity is therefore not simply an instrument specification. It is a characteristic of the complete measurement approach that determines whether a reported result can support the validation decision.
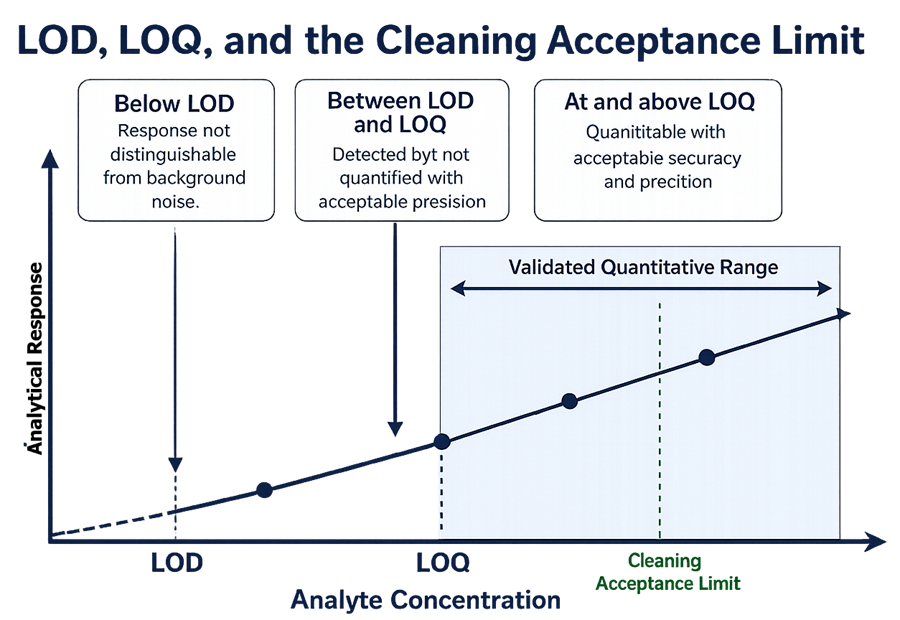
Two concepts are central to this assessment: the limit of detection (LOD) and the limit of quantitation (LOQ). LOD defines the lower level at which an analyte can be reliably distinguished from background, while LOQ defines the lower level at which the analyte can be quantitatively measured with acceptable performance. In cleaning validation, LOQ is usually the more important parameter when numerical results are compared directly with a residue acceptance criterion.
The required sensitivity should be defined during Analytical Method Selection for Cleaning Validation and confirmed as part of Analytical Method Validation for Cleaning Residue Testing. The objective is not to achieve the lowest technically possible LOD or LOQ. It is to establish a measurement procedure with sufficient capability to make the intended cleaning decision reliably.
Regulatory and Scientific Basis
FDA’s Guide to Inspections: Validation of Cleaning Processes states that cleaning-validation protocols should define the analytical methods used, including their sensitivity. The guide also emphasizes that a result reported as not detected does not demonstrate that no residue remains; it means that residue was not detected above the sensitivity or detection capability of the analytical method. FDA further expects the analytical method and sampling procedure to be evaluated together so that recovery from the equipment surface is understood.
For API manufacturing, FDA’s ICH Q7 Good Manufacturing Practice Guidance for Active Pharmaceutical Ingredients states that validated analytical methods should have sufficient sensitivity to detect residues or contaminants at the established acceptable level and that attainable sampling recovery should be established.
The current analytical framework is provided by FDA’s final ICH Q2(R2) Validation of Analytical Procedures. Q2(R2) uses the terms detection limit (DL) and quantitation limit (QL); the commonly used terms LOD and LOQ describe the same concepts in this article. Q2(R2) provides several approaches for estimating and validating lower-range limits and emphasizes that an analytical procedure should be demonstrated to be fit for its intended purpose.
Understanding LOD and LOQ
The limit of detection (LOD) is the lowest amount or concentration of analyte that can be reliably distinguished from background response, although the amount may not be quantified with acceptable accuracy and precision. A signal at or above LOD supports the conclusion that analyte is present, but it does not automatically provide a reliable numerical result.
The limit of quantitation (LOQ) is the lowest level at which the analytical procedure can provide a quantitative result with acceptable performance for its intended use. At and above the validated LOQ, the procedure should provide adequate response, accuracy, and precision within the applicable working range.
This distinction is important in cleaning validation because most residue acceptance criteria are numerical. If a surface limit is 0.02 µg/cm², for example, the analytical system must do more than recognize that residue exists. It must be able to support a reliable comparison with that limit after the effects of sampling, recovery, extraction, dilution, and matrix response have been considered.
Relationship to the Cleaning Acceptance Criterion
Analytical sensitivity should be derived from the scientifically justified cleaning requirement. The applicable residue limit is established through the broader limit strategy described in Cleaning Validation Acceptance Criteria and Surface, Swab, and Rinse Limits. The analytical method is then developed to measure the resulting sample concentration with adequate reliability.
No universal regulatory requirement establishes a fixed relationship such as LOQ ≤50% of the cleaning acceptance limit. The demonstrated LOQ should provide adequate quantitative capability at the concentration corresponding to the cleaning acceptance criterion in the actual analytical sample. Additional margin below the acceptance limit may be appropriate based on analytical uncertainty, recovery, matrix effects, residue risk, and the intended decision, but the margin should be scientifically justified rather than imposed as a fixed percentage.
For a quantitative cleaning result, the practical expectation is that the demonstrated LOQ should be at or below the concentration corresponding to the cleaning acceptance criterion in the actual analytical sample. If LOQ is above the acceptance limit, the procedure cannot reliably quantify residue in the region where the compliance decision must be made.
A substantial margin may simplify interpretation, but an unnecessarily low LOQ can also drive excessive method complexity without improving patient or product protection. FDA has cautioned against allowing progressively more sensitive analytical technology to redefine required cleanliness when the established residue limit is already scientifically justified.
The Acceptance Limit Must Be Converted to the Actual Sample Concentration
A surface acceptance criterion and an analytical concentration are not the same quantity. A residue limit expressed in µg/cm² must be converted into the amount or concentration expected in the swab extract, rinse sample, or other analytical preparation.
For a swab sample, the effective quantitative limit at the sampled surface depends on the analytical LOQ, sampled area, extraction volume, any additional dilution, and recovery efficiency.
Effective Surface LOQ = Analytical LOQ × Extraction Volume × Dilution Factor ÷ (Sampled Area × Recovery Fraction) , where:
Analytical LOQ = quantitative limit of the analytical method, typically µg/mL
Extraction Volume = volume used to extract the swab, mL
Dilution Factor = any additional dilution applied before analysis
Sampled Area = surface area represented by the swab, cm²
Recovery Fraction = demonstrated recovery expressed as a decimal, such as 0.70 for 70%
The treatment of sampling recovery should be consistent with the approved cleaning-validation procedure. Where results are mathematically corrected for recovery, the demonstrated recovery factor should be incorporated into the calculation. Where recovery is qualified but results are intentionally reported without correction, the relationship between analytical LOQ, recovery, and the applicable surface limit should be evaluated according to that established reporting convention.
For example, assume an analytical LOQ of 0.05 µg/mL, an extraction volume of 10 mL, a sampled area of 100 cm², no additional dilution, and a recovery of 70%.
Effective Surface LOQ = (0.05 µg/mL × 10 mL) ÷ (100 cm² × 0.70), Effective Surface LOQ ≈ 0.0071 µg/cm²
If the cleaning acceptance criterion is 0.02 µg/cm², the complete sampling and analytical procedure has quantitative capability below the decision limit. In this example, the effective surface LOQ is approximately one-third of the cleaning acceptance criterion.
The numerical example is illustrative only. Actual calculations should reflect the approved sampling procedure, analytical method, extraction volume, dilution scheme, sampled area, and demonstrated recovery.
For rinse sampling, the same principle applies, but the result may be strongly influenced by total rinse volume and the surface area represented by the sample. Rinse Sampling for Cleaning Validation can therefore require significantly greater analytical sensitivity than a concentrated swab extract because residue may be diluted into a much larger liquid volume.
Instrument Sensitivity Is Not Procedure Sensitivity
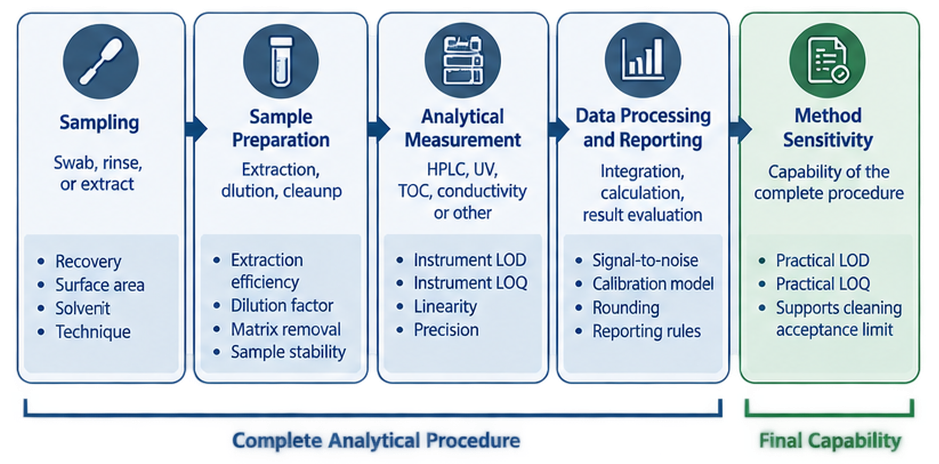
A common error is to treat the lowest concentration detectable by an instrument as the sensitivity of the cleaning-validation method. Instrument capability is only one element of the complete measurement system.
A residue on equipment must first be recovered from the surface or system. It may then be transferred from a swab into an extraction solvent, diluted during preparation, affected by the sample matrix, stored before analysis, and finally measured by the instrument. Loss or variability at any of these stages can reduce the effective capability of the procedure.
The relationship can be viewed as: Residue on equipment → sampling recovery → extraction → dilution → matrix/background → instrumental measurement → reported result
Swab and Rinse Recovery Studies for Cleaning Validation establish the efficiency with which residue can be transferred from representative surfaces into the analytical sample. Analytical LOQ should therefore not be interpreted independently from recovery. A detector capable of measuring extremely low concentrations cannot compensate for a sampling process that recovers residue poorly or inconsistently.
Approaches for Determining LOD and LOQ
ICH Q2(R2) provides several acceptable approaches for estimating lower-range analytical limits. The approach should be appropriate to the analytical technology and supported by experimental data rather than selected mechanically.
Visual Evaluation
Visual evaluation can be used for instrumental or noninstrumental procedures by analyzing samples containing known low concentrations and determining the minimum level at which the analyte can be reliably detected or quantified. Despite the name, this approach does not necessarily mean visual inspection of equipment; it refers to evaluation of the analytical response.
This approach can be useful where conventional signal-to-noise calculations are not applicable or where the analytical response is evaluated using another defined criterion.
Signal-to-Noise Ratio
For analytical procedures that exhibit baseline noise, LOD and LOQ can be estimated by comparing low-concentration analyte response with the response of blank samples or an appropriate baseline region.
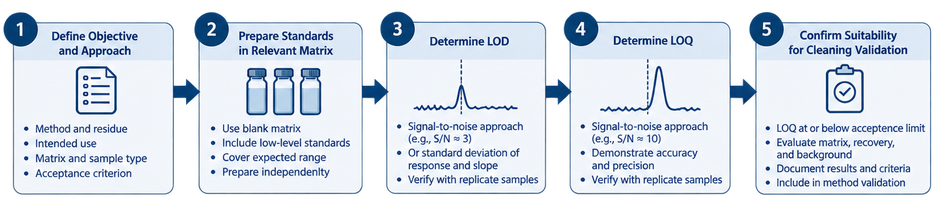
ICH Q2(R2) identifies a signal-to-noise ratio of approximately 3:1 as generally acceptable for estimating the detection limit and a ratio of at least 10:1 for estimating the quantitation limit. These ratios are estimation approaches, not universal cleaning-validation acceptance criteria.
Signal-to-noise evaluation is frequently applicable to chromatographic and other instrumental methods where the analytical signal can be compared meaningfully with baseline noise.
Standard Deviation of Response and Slope
ICH Q2(R2) also provides the statistical relationships:
LOD = 3.3σ / S
LOQ = 10σ / S
where:
- σ = standard deviation of the response
- S = slope of the calibration curve
The standard deviation may be derived from appropriate blank responses, residual variability of a low-level calibration curve, or variability of calibration-curve intercepts, depending on the method and study design.
A calculation produces an estimate. It does not by itself demonstrate that the procedure performs acceptably at that concentration in the actual cleaning-validation matrix.
Accuracy and Precision at the Lower Range
Q2(R2) also allows the quantitation limit to be validated directly through accuracy and precision measurements at the lower range. This approach is particularly relevant to cleaning validation because the critical question is not merely whether the instrument generates a signal, but whether the procedure can produce reliable quantitative results near the cleaning decision level.
Where an estimated LOD or LOQ is obtained mathematically, Q2(R2) recommends subsequent confirmation using samples prepared near the estimated limit, unless a justified exception applies.
Estimated LOQ Versus Validated Lower-Range Capability
The distinction between estimating LOQ and demonstrating quantitative capability is important. A value calculated from calibration statistics may predict where reliable quantitation should be possible, but actual performance should be evaluated using samples representative of the intended application.
For cleaning validation, those samples should account for the actual matrix where relevant. A standard solution prepared in clean solvent may behave differently from a swab extract containing swab-derived materials, residual detergent, excipients, salts, or other components. Similarly, a TOC procedure may perform differently in high-purity water than in a rinse sample containing measurable background carbon.
Q2(R2) states that an estimated QL can be subsequently validated by analysis of samples known to be near the proposed QL and that accuracy and precision should be demonstrated under regular test conditions, including relevant sample matrix and sample preparation.
For cleaning validation, the lower end of the working range should therefore be established where the complete analytical procedure continues to provide results suitable for the intended acceptance decision.
Blank and Background Effects
At low residue concentrations, blank and background response can become a significant component of the analytical signal. The lower the required LOQ, the more important it becomes to understand and control these contributions.
Relevant blank sources can include analytical reagents, extraction solvent, rinse water, swab materials, sample containers, filters, tubing, mobile phase, cleaning agents, laboratory environment, and the analytical instrument itself. A procedural blank that follows the same preparation steps as an actual sample can provide more useful information than an instrument blank alone.
For TOC applications, background control is particularly important. FDA states that background carbon from sources other than the contaminant should be limited as much as possible because TOC does not distinguish among different oxidizable carbon-containing compounds. FDA also notes that sample holding time can affect accuracy and LOQ and should be evaluated where samples are stored before analysis.
Blank subtraction should not be used automatically to create an apparently lower detection limit. Where blank correction is part of the method, the correction procedure, background variability, and effect on low-level accuracy should be established and controlled.
Matrix Effects and Interference
Sensitivity established in pure standards may not represent sensitivity in the actual cleaning sample. Cleaning-validation matrices can contain detergent components, excipients, salts, degradation products, swab extractables, rinse-water background, or other substances that alter analytical response.
Matrix effects can increase noise, suppress or enhance analyte response, change extraction efficiency, or create interfering signals near the analyte response. These effects can increase the practical LOQ even when the instrument itself is capable of measuring a much lower standard concentration.
The matrix and interference aspects of the method should be addressed together with specificity, accuracy, precision, and range in Analytical Method Validation for Cleaning Validation. The relevant matrix should be represented during lower-range confirmation whenever it can materially affect the measurement.
Reporting Results Below LOQ
The reporting convention for low-level results should be defined before cleaning-validation samples are analyzed. Terms such as ND, <LOD, detected below LOQ, and <LOQ do not mean the same thing and should not be used interchangeably.
A result reported as not detected means that the analyte response did not exceed the defined detection capability under the method conditions. It does not mean that residue is absent or equal to zero. FDA explicitly makes this distinction in its cleaning-validation inspection guide.
When analyte response is detected between LOD and LOQ, the method has indicated the presence of residue but has not demonstrated adequate quantitative reliability at that level. Reporting an exact numerical concentration in this region can imply more certainty than the validated procedure supports. A defined convention such as “detected, <LOQ” may be more appropriate, depending on the analytical procedure and data system.
If LOQ is demonstrably below the cleaning acceptance limit, a result below LOQ can generally support the conclusion that residue is below the acceptance criterion, provided the reporting convention and method capability are predefined and scientifically justified. If LOQ approaches or exceeds the acceptance limit, however, a below-LOQ result may not provide sufficient information to support the required quantitative decision.
Practical Sensitivity Can Often Be Improved Without Changing the Instrument
Where analytical capability is marginal relative to the cleaning limit, the first response should not automatically be acquisition of a more sensitive instrument. The complete procedure should be examined to determine where sensitivity is being lost.
For swab sampling, increasing the sampled area may increase the total analyte mass available for measurement, although recovery from a larger or more complex area must remain reproducible. Reducing extraction volume can increase analyte concentration, but sufficient solvent must remain available to extract the residue effectively from the swab. Avoiding unnecessary dilution can also improve practical sensitivity.
For rinse sampling, excessive rinse volume can produce substantial analyte dilution. The rinse volume and collection strategy should therefore be sufficient to contact the intended equipment surfaces without creating unnecessary analytical dilution. Any change must remain consistent with the validated sampling rationale.
Background can also be reduced through selection of low-extractable swabs, suitable containers, high-quality solvents or water, controlled reagents, and appropriate blank procedures. These improvements can lower practical LOQ without changing the core analytical technology.
Sensitivity for Specific and Nonspecific Methods
LOD and LOQ concepts apply differently depending on the analytical technique. HPLC and UHPLC methods may use chromatographic response, baseline noise, calibration statistics, and low-level accuracy/precision to establish lower-range capability. UV-visible methods may be constrained by absorbance background and lack of chromatographic separation.
For TOC, practical sensitivity depends heavily on background organic carbon, oxidation efficiency, sample handling, and the carbon content of the target material. A numerically low TOC instrument specification does not demonstrate that a specific product residue can be adequately controlled at the cleaning limit.
Conductivity can be very sensitive to ionic material, but background conductivity from water, salts, temperature effects, or unrelated ionic residues may limit its usefulness at low target concentrations. The appropriate analytical technology and its limitations are addressed in Analytical Method Selection for Cleaning Validation.
Documentation Expectations
The analytical method documentation should identify the established LOD and LOQ, the approach used to determine them, the data supporting the calculations or estimates, and the experimental confirmation performed near the lower limit where applicable. The relationship between LOQ and the cleaning acceptance criterion should be explicitly demonstrated rather than assumed.
Documentation should also identify the sample matrix used during confirmation, relevant blanks, background response, sample preparation, extraction and dilution factors, recovery considerations, and the reporting convention for results below LOD or LOQ.
Where the effective cleaning-validation sensitivity differs from the analytical-solution LOQ because of sampling or preparation factors, the conversion should be documented so that reviewers can trace the relationship between the instrument result and the applicable surface or rinse acceptance criterion.
Lifecycle and Change Control
LOD and LOQ should be reassessed when changes can affect lower-range performance. Relevant changes include a tighter cleaning acceptance limit, introduction of a new worst-case product, changes in extraction solvent or volume, new swab material, altered rinse volume, changes in detector or instrument platform, modification of chromatographic conditions, new matrix interferences, or changes in sample storage conditions.
A method can remain technically functional while becoming unsuitable for the cleaning-validation purpose if the applicable residue limit changes below its demonstrated quantitative capability. Conversely, changes that reduce background or improve recovery may improve effective procedure sensitivity and should be documented through the analytical lifecycle.
Common Deficiencies
Common deficiencies include reporting an instrument detection limit as though it were the capability of the complete cleaning-validation procedure; using an LOQ determined only in neat standard solution without evaluating the actual matrix; failing to account for recovery, dilution, or extraction volume; applying an arbitrary rule such as LOQ ≤50% of the cleaning limit without scientific rationale; and treating “not detected” as proof of zero residue.
Other weaknesses include reporting numerical values below the validated LOQ, failing to establish blank variability, using background subtraction without adequate control, allowing the cleaning limit to fall outside the validated quantitative range, and lowering residue acceptance criteria solely because a newer instrument can measure smaller amounts.
These deficiencies can make apparently precise analytical results scientifically unsuitable for the cleaning-validation decision.
Key Principles
LOD defines the lower level at which residue can be reliably detected, while LOQ defines the lower level at which it can be quantitatively measured with acceptable performance. For cleaning validation, the critical question is whether the complete sampling and analytical procedure can support the established acceptance criterion.
Analytical LOQ should be evaluated in the context of the actual sample concentration after sampling area, recovery, extraction, dilution, rinse volume, matrix effects, and background response are considered. Instrument sensitivity alone is not sufficient evidence of cleaning-validation capability.
LOD and LOQ may be estimated by signal-to-noise, response variability and calibration slope, visual evaluation, or other justified approaches, but estimates should be experimentally confirmed where lower-range performance is important to the intended use. Results below LOD or LOQ must be reported in a way that reflects the actual capability of the validated procedure.
The goal is not maximum analytical sensitivity. The goal is a scientifically justified and validated measurement system capable of making the required cleaning decision reliably.