

Continued Process Verification Reporting and State-of-Control Assessment
Continued Process Verification (CPV) generates ongoing evidence that a commercial manufacturing process continues to perform as intended. The value of CPV, however, does not come from collecting data or producing statistical charts alone. Process and product information must be periodically integrated, evaluated, documented, and translated into a scientifically justified conclusion about the continuing state of control.
FDA’s Process Validation: General Principles and Practices identifies the goal of Stage 3 as continued assurance that the process remains in a state of control during commercial manufacture. FDA expects manufacturers to collect and evaluate relevant process and product data, statistically trend the data where appropriate, and use the results to identify undesired variability and determine whether action is required.
A CPV report should therefore do more than summarize monitoring results. It should integrate relevant lifecycle evidence, evaluate whether the established control strategy remains effective, identify emerging risks or deterioration, and provide a documented conclusion regarding process performance and the validated state.
From CPV Monitoring to a State-of-Control Conclusion
CPV monitoring and state-of-control assessment are related but distinct activities. Routine CPV monitoring generates and evaluates information about process performance. This may include process parameters, material attributes, in-process measurements, Critical Quality Attributes (CQAs), yields, statistical trends, deviations, and other relevant indicators.
A state-of-control assessment integrates this information with other lifecycle evidence and asks a broader question: Does the totality of current evidence continue to support the conclusion that the process is understood, appropriately controlled, and capable of consistently delivering the intended product quality?
The answer should not depend on a single metric.
A process can continue to meet finished-product specifications while showing increasing variability, deteriorating capability, recurring deviations, material-related shifts, or other evidence that the established control strategy is becoming less effective. Conversely, an isolated statistical signal does not automatically establish that the process has lost its validated state. The assessment therefore requires scientific interpretation of the accumulated evidence.
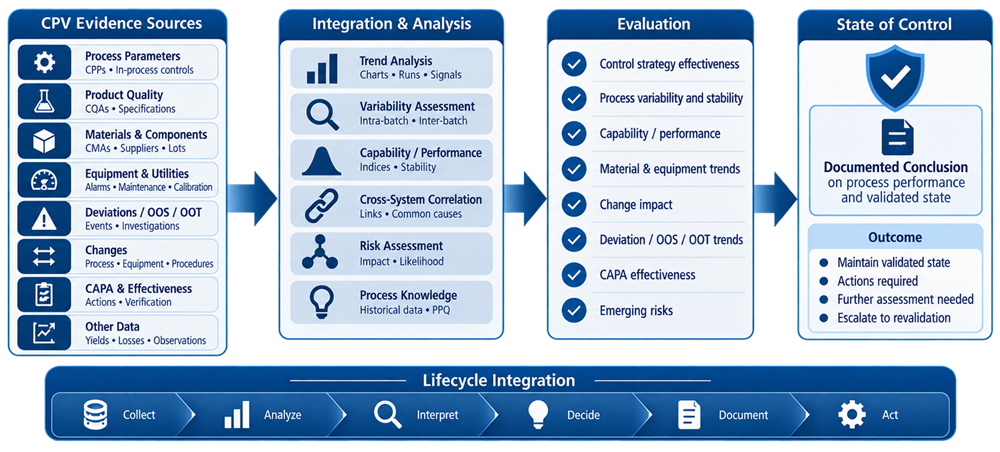
CPV Reporting Structure
The form and frequency of CPV reporting should reflect process risk, manufacturing frequency, process maturity, data volume, variability, and the monitoring strategy established for the product.
A CPV report may cover a defined period, number of batches, manufacturing campaign, or another scientifically justified interval. Higher-risk, newly commercialized, recently changed, or less stable processes may warrant more frequent review than mature processes with substantial evidence of consistent performance.
The report should identify the period and batches evaluated and describe the data included in the assessment. It should also identify relevant exclusions, missing data, unusual events, or limitations that could affect interpretation.
A useful reporting structure generally addresses:
- scope and reporting period;
- batches manufactured and evaluated;
- relevant process parameters and CQAs;
- material and component information;
- yield and process-performance measures;
- statistical trends and signals;
- deviations, OOS and OOT results;
- process-related equipment or measurement issues;
- significant changes implemented during the period;
- relevant CAPA and effectiveness information;
- comparison with prior reporting periods;
- control-strategy effectiveness;
- unresolved or emerging risks; and
- the documented state-of-control conclusion.
The report should focus on information that contributes to understanding process performance rather than becoming an indiscriminate compilation of every manufacturing record.
Process and Product Performance Data
CPV reporting should evaluate data selected because they provide meaningful information about process behavior and product quality. Depending on the process, this can include:
- CPPs and other significant process parameters;
- CQAs;
- in-process attributes;
- material attributes;
- batch yields and reconciliation;
- cycle or processing times;
- hold times;
- process losses;
- environmental or utility conditions that can affect process performance;
- relevant analytical results; and
- other process-specific indicators.
FDA specifically expects an ongoing program for collecting and analyzing product and process data related to product quality, including relevant process trends, incoming materials or components, in-process material, and finished products.
The data selected for CPV should therefore remain connected to the process knowledge and control strategy established during development and confirmed during Process Performance Qualification (PPQ).
See Continued Process Verification (CPV) Program and Monitoring Strategy for development of the monitoring program and selection of CPV data.
Assessment of Intra-Batch and Inter-Batch Variability
Variability should be evaluated at more than one level.
Intra-batch variability concerns variation occurring within an individual manufacturing batch. Depending on the process, this may involve location, processing time, filling sequence, equipment position, beginning-middle-end effects, or other sources of within-batch variation.
Inter-batch variability concerns differences among batches over time.
A process can produce acceptable individual batches while gradually changing from its historical behavior. Evaluation across multiple batches can therefore identify shifts in central tendency, increasing dispersion, recurring disturbances, or other changes that may not be apparent from individual batch disposition decisions.
FDA enforcement communications continue to emphasize ongoing monitoring of both intra-batch and inter-batch variation as part of maintaining a continuing state of control.
CPV reporting should therefore assess both dimensions where they are relevant to the process.
Statistical Trends and Process Capability
Statistical methods provide important evidence for state-of-control assessment, but they should support scientific interpretation rather than replace it. Depending on the data and process, CPV evaluation may include:
- control charts;
- run charts;
- trend analysis;
- measures of central tendency and dispersion;
- comparison among manufacturing periods;
- process capability or performance indices;
- regression or multivariate analysis;
- evaluation of shifts, trends, runs, or unusual patterns; and
- other statistically justified methods.
The method should be appropriate to the data structure, sample size, distribution, process behavior, and decision being made.
Process capability metrics require particular care. A capability index should not be treated as a universal validation acceptance criterion. Its usefulness depends on factors such as statistical stability, appropriate specification limits, distributional assumptions, sample size, and whether the underlying data adequately represent process performance.
A process can also exhibit an acceptable capability index while showing a meaningful trend that warrants investigation.
The detailed treatment of statistical signals and investigations belongs in Process Drift, Statistical Signals, and CPV Investigation.
Deviations, OOS, OOT, and Investigation Trends
CPV reporting should integrate relevant quality events rather than evaluate statistical process data in isolation. This includes trends in:
- manufacturing deviations;
- process excursions;
- atypical observations;
- Out-of-Specification (OOS) results;
- Out-of-Trend (OOT) results;
- recurring alarms or interventions;
- rejected or reprocessed batches;
- recurring investigation causes; and
- other events that may indicate weaknesses in process control.
A single event may have little significance after investigation. Repetition of similar events across batches can have substantially greater significance.
The CPV assessment should therefore consider frequency, recurrence, common causal mechanisms, affected process steps, effectiveness of previous corrective actions, and whether the events reveal a source of variability that is not adequately controlled.
Repeated deviations that are individually closed should not disappear from lifecycle evaluation merely because each investigation was administratively completed.
Material and Component Trends
Incoming materials and components can be significant sources of process variability. CPV reporting should evaluate material-related information when differences in material properties can affect process performance or product quality.
Relevant information may include:
- supplier or manufacturing-site changes;
- lot-to-lot variability;
- Critical Material Attributes (CMAs);
- changes in physical or chemical properties;
- component dimensions or performance;
- material-related deviations;
- incoming test trends; and
- relationships between material characteristics and process performance.
FDA specifically includes the quality of incoming materials or components among the information expected in continued process verification.
A material can remain within its approved specification while changes within that specification range influence process behavior. CPV should therefore use process knowledge rather than relying exclusively on incoming-material pass/fail status.
Equipment, Measurement, and Automation Trends
Process performance can also be affected by deterioration or changes in the systems used to execute and monitor the process. Relevant CPV evidence may include:
- recurring equipment faults;
- process-related maintenance events;
- calibration failures or significant adjustment history;
- sensor drift;
- control-loop performance;
- recurring alarms;
- equipment replacement or modification;
- automation changes;
- measurement-system problems; and
- other equipment conditions associated with process variability.
The purpose is not to duplicate equipment qualification, calibration, maintenance, or computerized-system review. The CPV assessment should incorporate these records when they provide evidence relevant to the manufacturing process.
A recurring equipment problem that repeatedly affects a CPP, for example, is process-validation information even if every individual maintenance work order has been closed.
Yield and Process-Loss Trends
Yield can provide useful information about process consistency. Changes in theoretical or actual yield, reconciliation, scrap, rejects, recovery, or process losses can indicate changes in material behavior, equipment performance, operator practices, processing efficiency, or the manufacturing process itself.
Yield should not automatically be treated as a CQA or CPP. Its value in CPV depends on its relationship to the specific process. Where yield is meaningful, the assessment should evaluate patterns over time rather than only whether individual batches satisfy an established yield range.
A progressive decline in yield within the approved range may warrant evaluation if it represents a change from established process behavior.
Evaluation of Process Changes
Changes implemented during the reporting period should be considered when interpreting CPV data. Relevant changes can include:
- raw materials or suppliers;
- process parameters or operating ranges;
- batch size;
- manufacturing equipment;
- utilities;
- manufacturing site or area;
- automation or control logic;
- analytical or measurement methods;
- procedures;
- hold times;
- process sequence; and
- the control strategy itself.
The assessment should determine whether expected post-change performance has been achieved and whether monitoring has identified any unintended effect.
Changes should not be evaluated solely at the time they are approved. Where appropriate, CPV provides post-implementation evidence that assumptions made during change assessment were correct.
ICH Q9(R1) specifically identifies change control and product-review results among events that can trigger reconsideration of previous risk decisions as new knowledge and experience accumulate.
See Process Change Control, Revalidation, and Lifecycle Management for the broader process-validation change-control framework.
Control-Strategy Effectiveness
A central purpose of CPV reporting is to determine whether the established process control strategy continues to perform effectively. The assessment should consider whether:
- relevant material variability remains adequately controlled;
- operating ranges remain appropriate;
- CPPs and other important parameters remain controlled;
- in-process controls remain effective;
- alarms and interventions are functioning as intended;
- sampling and testing continue to provide meaningful information;
- procedural controls remain adequate;
- process variability remains acceptable;
- recurring deviations reveal weaknesses in existing controls; and
- new process knowledge requires modification of the control strategy.
ICH guidance recognizes that the control strategy can be refined during commercial manufacture as new knowledge is gained and specifically identifies data trends as a source of information for lifecycle improvement.
See Process Control Strategy Lifecycle Management for management of the control strategy after its initial establishment.
Integrating the Evidence
A useful CPV report should not consist of independent sections that are never brought together. The important step is integration.
For example:
- a statistical shift may coincide with a supplier change;
- increasing process variability may correlate with equipment deterioration;
- recurring deviations may occur near one end of an established operating range;
- a reduction in capability may follow a batch-size change;
- an OOT trend may coincide with a change in material characteristics;
- yield deterioration may precede product-quality changes; or
- a CAPA may reduce one failure mode while another indicator continues to deteriorate.
These relationships may only become apparent when evidence from different quality systems is evaluated together.
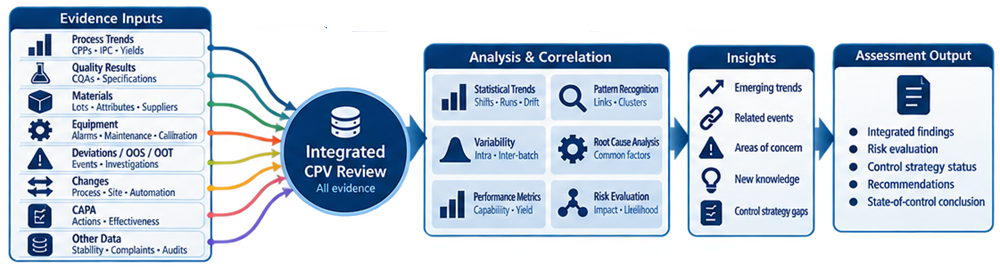
The objective is not to force every observation into a common numerical score. It is to determine whether the combined evidence changes the current understanding of process performance, variability, risk, or control.
Determining the State of Control
A state-of-control conclusion should be explicit and supported by documented rationale. The assessment should consider questions such as:
- Does the process continue to perform within its established control strategy?
- Are CPPs, CQAs, and other meaningful indicators behaving as expected?
- Is variability stable and adequately understood?
- Are significant statistical signals adequately explained?
- Are deviations or investigations revealing recurring weaknesses?
- Have material, equipment, or process changes altered process behavior?
- Are existing controls still effective?
- Are previous CAPAs effective?
- Has new knowledge changed the understanding of process risk?
- Is additional monitoring, investigation, characterization, qualification, or validation work required?
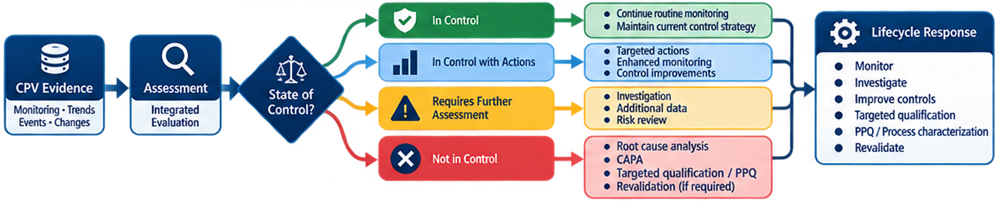
The conclusion should reflect the totality of evidence rather than a mechanical pass/fail calculation. A useful conclusion may determine that the process:
- Remains in a state of control — available evidence continues to support the validated state and the existing control strategy remains effective.
- Remains in control with actions required — the process continues to provide acceptable assurance, but identified trends, risks, or weaknesses require defined corrective, preventive, monitoring, or improvement actions.
- Requires further assessment before the state of control can be confirmed — available evidence contains unresolved signals or uncertainty significant enough to require additional investigation or data.
- No longer provides adequate assurance of a continuing state of control — evidence indicates that process performance or the effectiveness of controls has deteriorated sufficiently to require escalation and potentially revalidation.
These categories are useful governance concepts, not FDA-prescribed regulatory classifications. The organization should define terminology and decision criteria appropriate to its quality system.
Escalation and Lifecycle Response
An adverse CPV conclusion does not automatically mean that complete process revalidation is required. The response should be proportional to the evidence, risk, and extent of uncertainty. Possible actions include:
- continued routine monitoring;
- increased monitoring frequency;
- additional sampling;
- targeted statistical evaluation;
- investigation;
- material or supplier assessment;
- equipment evaluation;
- measurement-system assessment;
- process characterization;
- modification of operating controls;
- CAPA;
- control-strategy revision;
- targeted qualification;
- targeted PPQ activities;
- additional PPQ batches; or
- broader process revalidation.
Quality Risk Management should support the scope and urgency of the response. ICH Q9(R1) — Quality Risk Management describes risk review as an ongoing activity that should incorporate new knowledge and experience and reconsider previous risk decisions when relevant events occur.
CAPA and Effectiveness Verification
CAPA generated from CPV findings should remain connected to subsequent process-performance data. Closing a CAPA after implementing an action does not by itself demonstrate that the underlying process issue has been effectively controlled.
Effectiveness verification should determine whether the expected improvement is visible in relevant process and product data. Depending on the issue, this may involve:
- disappearance of a recurring statistical signal;
- reduction in variability;
- improved capability;
- elimination of recurring deviations;
- improved material consistency;
- improved equipment performance;
- stabilization of a process parameter; or
- restoration of expected yield or product-quality performance.
CPV therefore provides an important mechanism for evaluating whether lifecycle actions actually achieved their intended effect.
Management Review and Escalation
Significant CPV conclusions should be communicated through the pharmaceutical quality system at an appropriate management level.
ICH Q10 — Pharmaceutical Quality System expects management review to include conclusions from process-performance and product-quality monitoring and the effectiveness of process and product changes, including those arising from CAPA. It also calls for effective communication and escalation of appropriate quality issues.
Management review does not replace technical CPV assessment or Quality Unit approval. Its role is to ensure that significant process-performance issues receive appropriate visibility, resources, cross-functional action, and follow-up.
The level of escalation should reflect the significance of the issue rather than the routine reporting calendar.
CPV Reporting and APR/PQR
CPV reporting and Annual Product Review/Product Quality Review can use many of the same data sources, but they serve different purposes and should not automatically be treated as interchangeable.
CPV is specifically concerned with continuing process performance, variability, control, and the validated state.
APR/PQR has a broader product-quality and CGMP review function. Depending on the applicable regulatory framework and company system, it may include batches manufactured, specifications, complaints, recalls, stability, changes, deviations, investigations, rejected batches, and other product-quality information.
Under 21 CFR 211.180(e), manufacturers are required to conduct at least annual evaluations of drug-product quality standards to determine the need for changes in specifications or manufacturing and control procedures. FDA also cites this requirement directly in its Stage 3 discussion.
The systems can therefore be integrated operationally, provided the CPV component remains sufficiently detailed to evaluate process behavior and continuing state of control.
A single annual report may be inadequate for a process requiring more frequent CPV evaluation. Reporting frequency should be driven by process risk and the need for timely detection of meaningful changes.
Roles and Responsibilities
CPV reporting is inherently cross-functional. Typical contributors can include:
- Manufacturing — process execution, operational observations, deviations, and process changes.
- Quality Unit — oversight, investigations, CAPA, change control, quality-event trends, and approval of lifecycle conclusions.
- Validation — validation strategy, PPQ history, CPV program, validated-state assessment, and revalidation evaluation.
- Process Engineering or Technical Operations — process understanding, equipment/process interactions, characterization, and technical investigation.
- Statistics or appropriately trained personnel — statistical methods, data interpretation, process stability, and capability assessment.
- Laboratory/Analytical functions — CQA data, analytical trends, OOS/OOT information, and measurement-system considerations.
- Materials/Supply Chain — supplier and material changes where relevant to process performance.
The specific organization may differ, but ownership of data, review, investigation, approval, escalation, and follow-up should be defined.
FDA recommends that the data-collection plan and statistical methods used to evaluate process stability and capability be developed by a statistician or person with adequate statistical-process-control training.
Documentation and Traceability
The CPV report should permit reconstruction of how the state-of-control conclusion was reached. Traceability should connect conclusions to the supporting evidence, including:
- source datasets;
- batches evaluated;
- statistical analyses;
- deviations and investigations;
- OOS/OOT records;
- changes;
- CAPAs;
- material or supplier assessments;
- relevant equipment events;
- previous CPV conclusions; and
- resulting lifecycle actions.
Data exclusions, transformations, aggregation methods, and statistical assumptions should be documented sufficiently to allow independent review.
The objective is not documentation volume. It is a defensible chain of evidence from source data through evaluation to the final process-validation decision.
See Process Validation Documentation and Traceability and Data Integrity and Good Documentation Practices in Process Validation for the broader documentation and data-governance requirements.
Relationship to Quality Risk Management and Knowledge Management
CPV reporting should increase process knowledge rather than simply archive historical performance.
New knowledge may alter:
- understanding of material-process relationships;
- assessment of CPPs or other parameters;
- assumptions concerning process variability;
- monitoring priorities;
- risk rankings;
- control-strategy elements;
- sampling plans;
- acceptance criteria; or
- revalidation decisions.
This creates a feedback mechanism:
Manufacturing Data → CPV Evaluation → New Process Knowledge → Risk Review → Control/Lifecycle Decision → Subsequent Monitoring
That feedback is fundamental to lifecycle process validation.
ICH Q9(R1) establishes that risk decisions should be reviewed as new knowledge and experience become available, while ICH Q10 positions knowledge management, process-performance monitoring, CAPA, change management, and management review as interacting elements of the pharmaceutical quality system.
See Lifecycle Integration and Knowledge Management in Process Validation for the broader lifecycle knowledge framework.
Maintaining a Continuing State of Control
The final purpose of CPV reporting is not to produce a favorable report. It is to determine whether current evidence continues to justify reliance on the validated process.
A robust state-of-control assessment integrates statistical evidence with process knowledge, deviations, investigations, materials, equipment performance, changes, CAPA effectiveness, and the continuing effectiveness of the control strategy.
Where evidence remains favorable, CPV provides documented assurance that the process continues to operate as intended.
Where evidence indicates deterioration, uncertainty, or emerging risk, the CPV system should cause action before loss of process control becomes a recurring product-quality problem.
This is the fundamental lifecycle role of Stage 3: converting routine commercial manufacturing experience into continuing scientific assurance that the process remains capable, controlled, and validated.