

Sterility Assurance Level and Sterilization Kinetics
Sterility assurance level, or SAL, expresses the probability of a viable microorganism occurring on an item after a validated sterilization process. It is a probabilistic process outcome—not proof that every processed unit is absolutely sterile and not a result that can be established by testing a small sample of finished units.
Sterilization kinetics provide the scientific connection between the initial microbial population, microbial resistance, delivered process exposure, expected survivors, and the claimed SAL. This connection may involve bioburden data, D-values, z-values, accumulated lethality, biological indicators, dose measurements, and validated process parameters.
The applicable SAL and validation approach depend on the product, sterilization method, intended use, regulatory framework, and relevant standards. Although an SAL of 10⁻⁶ is commonly applied to terminally sterilized sterile drug products and medical devices, it should not be presented as an automatic universal requirement for every sterilization application.
Purpose and Scope
This article explains:
- What SAL means and does not mean
- The relationship between microbial population and probability
- Logarithmic microbial reduction
- D-value and microbial resistance
- z-value and temperature dependence
- Lethality and equivalent exposure
- Survivor curves and their limitations
- Overkill, bioburden-based, and combined approaches
- The role of biological indicators
- Why sterility testing cannot establish SAL
- The boundary between terminal sterilization and aseptic processing
- Validation and lifecycle evidence supporting a sterility-assurance claim
Individual technologies and their specific validation requirements are addressed in the relevant sterilization-method articles.
What Sterility Assurance Level Means
ISO 11139 defines SAL in terms of the probability of a viable microorganism occurring on an item after sterilization. The standard is a sterilization vocabulary reference, not a standalone validation procedure. ISO 11139:2018 was confirmed as current in 2024 and is supplemented by Amendment 1:2024.
An SAL of 10⁻⁶ is commonly communicated as a probability of no more than one viable microorganism occurring on one item in one million sterilized items.
This statement requires careful interpretation.
It does not mean that:
- Exactly one contaminated unit will be present in every million units
- A manufacturer may knowingly distribute one contaminated unit
- One million finished units were tested
- Each individual unit has been demonstrated to be sterile
- SAL is a finished-product acceptance sampling plan
- All sterilization applications require the same SAL
- A passing sterility test proves that the claimed SAL was achieved
SAL is supported by a validated process model and process-control evidence. It is not directly observed by examining every processed unit.
Sterility Is a Probabilistic State
Absolute absence of microorganisms cannot be demonstrated by destructive testing of every manufactured item. Sterilization is therefore defined and controlled as a process that reduces the probability of viable microorganisms to a specified level.
The evidence supporting that probability may include:
- Initial product or load bioburden
- Microorganism types and resistance
- Biological-indicator population and resistance
- Physical process measurements
- Heat, gas, vapor, or radiation penetration
- Delivered lethality or absorbed dose
- Worst-case load configuration
- Cycle-development studies
- Equipment qualification
- Performance qualification
- Routine-cycle records
- Bioburden monitoring
- Sterilizer maintenance and calibration
- Change control and requalification
The strength of the SAL claim depends on the validity of the complete evidence chain, not on a single calculation.
Microbial Population and Logarithmic Reduction
Microbial inactivation is commonly represented on a logarithmic scale.
A one-log₁₀ reduction means that the viable population has been reduced by a factor of ten:
| Log₁₀ reduction | Fraction remaining | Nominal reduction |
|---|---|---|
| 1 log | 10⁻¹ | 90% |
| 2 logs | 10⁻² | 99% |
| 3 logs | 10⁻³ | 99.9% |
| 6 logs | 10⁻⁶ | 99.9999% |
| 12 logs | 10⁻¹² | 99.9999999999% |
Percent reduction can be useful for explanation but becomes less informative at high lethality. Sterilization validation is therefore generally expressed through logarithmic population reduction, expected survivors, delivered lethality, or absorbed dose.
For an idealized log-linear process:
Expected survivors per item = N₀ × 10⁻ᴸ
where:
- N₀ is the initial microbial population per item
- L is the delivered log₁₀ reduction
- N is the expected number of survivors per item
Rearranging:
L = log₁₀(N₀) − log₁₀(N)
At very low expected survivor values, the probability of at least one survivor is approximately equal to the expected survivor value. The exact relationship under a Poisson model is:
Probability of at least one survivor = 1 − e⁻ᴺ
When N is very small, such as 10⁻⁶, this probability is effectively approximately 10⁻⁶. The distinction matters because expected survivors and probability are related but are not mathematically identical at higher population values.
Example: Bioburden, Reduction, and SAL
Assume:
- Initial bioburden: 10³ viable microorganisms per item
- Target expected survivor level: 10⁻⁶ per item
- Log-linear inactivation remains applicable through the required exposure
The required reduction would be:
L = 3 − (−6) = 9 logs
The simplified model therefore requires nine log₁₀ reductions:
| Stage | Expected population |
|---|---|
| Initial population | 10³ |
| After 3-log reduction | 10⁰, or one expected survivor |
| After 6-log reduction | 10⁻³ |
| After 9-log reduction | 10⁻⁶ |
This is a mathematical illustration, not a complete cycle-development justification. The calculation remains dependent on:
- Accuracy and representativeness of the initial bioburden
- Resistance of the relevant microorganisms
- Applicability of the assumed survivor-curve model
- Process penetration into the worst-case location
- Reproducibility of the delivered exposure
- Control of routine operating conditions
Survivor Curves
A survivor curve plots the logarithm of the viable microbial population against cumulative sterilization exposure. Under an ideal log-linear model, equal exposure increments produce equal log reductions.
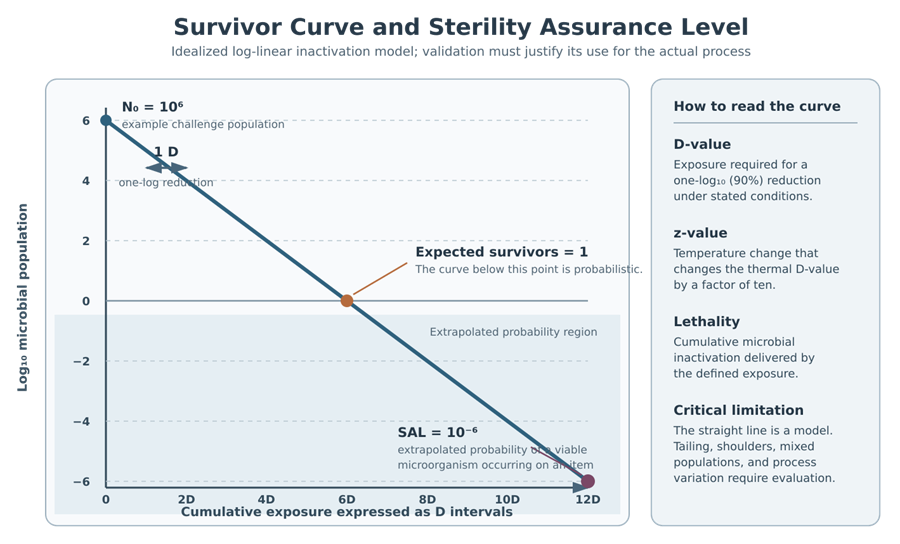
The upper part of the curve represents expected populations that can potentially be measured through enumeration studies. Once the expected population falls below one survivor per item, the curve represents an extrapolated probability region.
The lower portion of the curve should not be interpreted as direct enumeration of fractional microorganisms. A value of 10⁻⁶ represents a probability derived from the validated inactivation model.
D-Value
The decimal-reduction time, or D-value, is the exposure required under specified conditions to reduce a microbial population by one log₁₀, equivalent to a 90% reduction.
For a log-linear survivor curve:
D = exposure interval required for one-log₁₀ reduction
Examples include:
- Minutes at a specified moist-heat temperature
- Minutes at specified dry-heat conditions
- Exposure time under defined gas concentration, humidity, and temperature
- Radiation dose required for a one-log reduction
A D-value is incomplete unless its test conditions are identified. It may be affected by:
- Microorganism species and strain
- Physiological state of the microorganism
- Spore preparation
- Carrier material
- Product formulation
- Water activity
- pH
- Temperature
- Sterilant concentration
- Relative humidity
- Recovery method
- Enumeration method
A D-value reported on a biological-indicator certificate under reference conditions may not represent the organism’s resistance inside the actual product, component, or process challenge device. Biological-indicator selection and resistance must therefore be connected to actual process conditions.
D-Value Example
If a biological indicator contains 10⁶ spores and has a D₁₂₁ value of 1.5 minutes under applicable conditions:
- One D interval, or 1.5 minutes, theoretically reduces 10⁶ to 10⁵
- Six D intervals, or 9 minutes, theoretically reduce 10⁶ to 10⁰
- Twelve D intervals, or 18 minutes, theoretically reduce 10⁶ to 10⁻⁶
This calculation assumes constant exposure conditions and log-linear inactivation. Come-up time, changing temperature, product heating, and nonuniform exposure require an accumulated-lethality calculation rather than simple multiplication.
z-Value
For thermal sterilization, the z-value is the temperature change required to change the D-value by a factor of ten.
A lower temperature generally produces a higher D-value because the microorganism is inactivated more slowly. A higher temperature generally produces a lower D-value.
The relationship may be expressed as:
log₁₀(D₂ ÷ D₁) = (T₁ − T₂) ÷ z
where:
- D₁ and D₂ are D-values at temperatures T₁ and T₂
- z is the temperature change producing a tenfold change in D-value
If the z-value is 10°C, increasing the exposure temperature by 10°C theoretically decreases the D-value by a factor of ten, provided the model is applicable.
The z-value is principally a thermal-resistance parameter. It should not be transferred indiscriminately to EtO, VHP, radiation, or other processes governed by different kinetic relationships.
Lethality
Lethality represents the cumulative microbial-inactivation capability delivered by a sterilization process.
At constant conditions, the theoretical log reduction may be estimated as:
Log₁₀ reduction = exposure time ÷ D-value
When temperature changes during a moist-heat cycle, each time interval contributes a different amount of lethality. Equivalent lethality may be calculated relative to a reference temperature.
For saturated-steam processes, F₀ is commonly calculated as:
F₀ = ∫ 10^[(T(t) − 121.1) ÷ z] dt
where:
- T(t) is the measured product or load temperature at time t
- 121.1°C is the conventional F₀ reference temperature
- z is conventionally 10°C unless a different justified value applies
- dt is the time interval
F₀ expresses equivalent minutes at the reference temperature. It does not independently prove sterilization because it does not establish:
- Initial bioburden
- Microbial resistance
- Steam quality
- Air removal
- Load penetration
- Sensor suitability
- Worst-case location
- Product compatibility
- Reproducibility
These factors are addressed during steam-cycle development, temperature mapping and heat-penetration studies, and steam-sterilizer qualification.
Survivor-Curve Limitations
The straight survivor line is a useful model, but real microbial populations may not produce perfect log-linear behavior.
Potential deviations include:
Shoulder
An initial exposure period may produce limited observable reduction before log-linear inactivation begins. Possible causes include repair mechanisms, protective product effects, or the need to establish effective process conditions.
Tailing
The survivor curve may flatten at extended exposure. Possible causes include:
- A resistant subpopulation
- Microbial clumping
- Protected or occluded organisms
- Sterilant-distribution limitations
- Carrier or product effects
- Inadequate recovery methods
- Mixed microbial populations
Biphasic Inactivation
Different population groups may exhibit different resistance characteristics, producing more than one apparent slope.
Process Variability
Even when the underlying organism follows log-linear kinetics, variable heat penetration, gas concentration, humidity, dose distribution, or load configuration can cause the delivered exposure to differ among locations.
Cycle development must determine whether the selected kinetic model adequately represents the actual system. Extrapolating several logs beyond the experimentally observed data requires scientific justification and conservative assumptions.
Overkill Validation Approach
An overkill process is designed to provide sterilization exposure substantially greater than that required for the expected routine bioburden.
A commonly used moist-heat overkill model challenges a biological-indicator population of approximately 10⁶ spores and demonstrates a 12-log reduction capability:
- Six logs reduce the theoretical 10⁶ BI population to one expected survivor
- Six additional logs reduce the theoretical expected survivor level to 10⁻⁶
FDA’s aseptic-processing guidance describes an overkill sterilization process as one sufficient to provide at least a 12-log reduction of microorganisms having a minimum D-value of one minute. This definition is applicable in its stated pharmaceutical context and should not be treated as the only possible overkill model for every sterilization technology. FDA aseptic-processing guidance.
Advantages of an overkill approach may include:
- Reduced dependence on precise routine-bioburden resistance data
- Conservative microbial challenge
- Straightforward lethality calculations
- Strong process margin for heat-stable materials
Limitations may include:
- Excessive thermal or chemical exposure
- Product or material degradation
- Longer processing time
- Increased sterilant use
- Increased residues or aeration time
- Reduced equipment capacity
Overkill is a validation strategy, not permission to ignore routine contamination control or load definition.
Bioburden-Based Approach
A bioburden-based approach establishes process exposure using the number and resistance of microorganisms associated with the actual product, components, or manufacturing process.
This approach may be used when excessive exposure would damage the product or when the applicable sterilization standard provides an established bioburden-based method.
The supporting program may require:
- Validated bioburden test methods
- Representative sampling
- Organism identification
- Resistance characterization
- Evaluation of seasonal and supplier variation
- Product-family justification
- Defined presterilization holding conditions
- Bioburden alert or action criteria
- Evaluation of atypical or resistant isolates
- Continued routine-bioburden monitoring
- Change assessment when upstream controls change
The approach must account for both microbial count and resistance. A low count of highly resistant microorganisms may present a greater challenge than a higher count of less resistant organisms.
Combined BI/Bioburden Approach
A combined approach uses both product-bioburden information and a biological indicator whose resistance relationship to the product bioburden has been established.
The biological indicator provides a standardized process challenge, while bioburden data establish the relevance of that challenge to the actual product.
The approach may permit a cycle with less exposure than a full overkill cycle while maintaining the required sterility assurance. It requires stronger continuing control of:
- Product bioburden
- Microbial resistance
- BI population and resistance
- Process-challenge-device suitability
- Load configuration
- Sterilant penetration
- Routine process parameters
FDA’s terminal-sterilization review materials distinguish overkill, bioburden-based, and combined BI/bioburden-based processes. FDA Question-Based Review for Sterility Assurance.
Comparison of Validation Approaches
| Approach | Principal basis | Main advantage | Main dependency |
|---|---|---|---|
| Overkill | Conservative BI population and resistance | Strong process margin and reduced dependence on actual bioburden resistance | Product must tolerate the required exposure |
| Bioburden-based | Actual product bioburden and resistance | Exposure can be matched more closely to product needs | Extensive and continuing bioburden knowledge |
| Combined BI/bioburden | Qualified BI related to actual bioburden | Standardized challenge with product-specific justification | Valid relationship among BI, product bioburden, and process |
| Dose-establishment method | Bioburden and standardized radiation-dose methodology | Appropriate framework for radiation sterilization | Dosimetry, bioburden control, verification-dose studies and dose audits |
The method must follow the applicable technology-specific standard. A 12-D moist-heat model should not automatically be imposed on radiation dose establishment, sterilizing filtration, or other processes using different validation principles.
Biological Indicators and SAL
Biological indicators provide a known microbial challenge with defined population and resistance. They may support process development, performance qualification, routine monitoring, or requalification, depending on the sterilization technology and approved strategy.
A BI result must be interpreted with the physical process data.
A negative BI result means no growth was detected under the defined recovery and incubation conditions. It does not independently prove that:
- The BI was placed at the true worst-case location
- The sterilizing condition reached every product location
- The required SAL was achieved
- The routine load remained within the validated configuration
- The equipment operated within all approved parameters
A positive BI may indicate insufficient lethality, unsuitable placement, BI damage, handling contamination, recovery error, incubation error, or another failure requiring investigation.
BI selection, qualification, placement, incubation, controls, and lifecycle management are addressed in Biological Indicators for Sterilization Validation.
Why Sterility Testing Cannot Establish SAL
A sterility test examines only a small sample from a batch. A passing result means that no microorganism was detected in the tested units under the conditions of the test. It does not demonstrate that the entire batch is sterile or that an SAL of 10⁻⁶ was achieved.
SAL is supported by validation evidence showing that the sterilization process consistently delivers the required microbial reduction. This evidence includes bioburden and resistance data, process development, qualification, physical process measurements, biological challenges where applicable, routine parameter review, and lifecycle control.
USP General Chapter <71> addresses sterility testing. The test remains an important finished-product quality-control test where required, but it does not measure SAL or replace sterilization-process validation.
SAL and Parametric Release
Parametric release permits product disposition based on documented compliance with validated sterilization-process parameters instead of relying on a finished-product sterility test as the primary release evidence.
This approach reinforces the principle that sterility assurance is established through process knowledge and control.
A parametric-release program requires more than an acceptable F₀ result. It depends on:
- A qualified sterilizer
- A validated load and cycle
- Defined critical process parameters
- Reliable calibrated instrumentation
- Complete cycle records
- Established process alarms
- Effective deviation handling
- Microbial and presterilization controls
- Approved release procedures
- Continued verification and requalification
FDA addresses parametric release for eligible terminally moist-heat-sterilized parenteral products in CPG Sec. 490.200.
SAL and Aseptic Processing
Aseptic processing must not be described as producing a calculable terminal-sterilization SAL of 10⁻⁶.
In aseptic manufacturing:
- Product, components, equipment, and containers may be sterilized separately
- Sterilizing-grade filtration may remove microorganisms from a fluid
- Sterile materials are assembled or filled under controlled conditions
- No final microbial-inactivation process is applied to the sealed product
- Contamination risk is controlled rather than converted into a terminal lethality calculation
Sterility assurance for aseptically processed products is supported through an integrated control strategy that includes:
- Sterile filtration validation
- Container and closure sterilization
- Equipment sterilization
- Facility and HVAC qualification
- Environmental monitoring
- Personnel qualification
- Aseptic-process simulations
- Intervention control
- Sterile-boundary integrity
- Container-closure integrity
- Bioburden and hold-time control
- Investigation and trending
Media fills challenge the aseptic process but do not establish a numerical SAL equivalent to a terminal sterilization cycle. The two approaches provide different forms of evidence and should not be mathematically equated.
The manufacturing boundary is discussed further in aseptic filling-line architecture.
Evidence Required to Support an SAL Claim
A defensible sterility-assurance claim should be traceable through the following evidence.
Product and Process Definition
- Intended product and sterile claim
- Required SAL
- Applicable regulatory framework
- Sterilization technology
- Product and packaging configuration
- Product and load families
- Maximum acceptable exposure
- Routine release method
Microbiological Basis
- Bioburden method and data
- Organism identity where required
- Resistance information
- BI selection and qualification
- D-value or dose-response data
- Process-challenge-device rationale
- Worst-case microbial challenge
Physical Process Evidence
- Critical process parameters
- Sensor locations
- Calibration status
- Heat, gas, vapor, or radiation penetration
- Distribution or dose mapping
- Accumulated lethality
- Minimum and maximum exposure
- Load configuration
- Failure and recovery conditions
Validation Evidence
- Approved cycle-development studies
- Installation and operational qualification
- Performance qualification
- Repeated successful studies
- Deviations and investigations
- Traceability to requirements
- Approved validation report
- Formal process release
Routine and Lifecycle Evidence
- Cycle or dose record review
- Bioburden monitoring
- BI or process-indicator results where applicable
- Alarm and deviation trends
- Maintenance and calibration
- Product and load changes
- Utility and software changes
- Periodic review
- Requalification
Lifecycle Control of Sterility Assurance
SAL is not established once and then assumed indefinitely. The validated state depends on continued control of the conditions supporting the original probability claim.
Changes requiring documented assessment may include:
- Product formulation
- Container or closure
- Packaging material
- Load size or orientation
- Product density
- Maximum or minimum load
- Bioburden level or resistance
- Raw-material or component supplier
- Sterilizer configuration
- Instrumentation
- Control software
- Process setpoints or operating ranges
- Utilities
- Biological indicator
- Process challenge device
- Contract sterilization site
- Hold time
- Cleaning or assembly process
The assessment must determine whether the existing data remain representative and whether targeted or comprehensive requalification is required. Relevant controls are addressed in GMP change-control impact assessment and risk-based requalification.
Common Errors
Common sterility-assurance weaknesses include:
- Defining SAL as proof of absolute sterility
- Presenting 10⁻⁶ as universal for all sterilization applications
- Treating one-in-a-million language as a literal production defect rate
- Equating expected survivors with exact probability without identifying the model
- Calculating SAL without considering initial bioburden
- Using a D-value without stating the exposure conditions
- Applying a supplier BI D-value directly to the product environment
- Assuming every survivor curve is log-linear
- Ignoring shoulders, tailing, or resistant subpopulations
- Using F₀ as the only evidence of moist-heat sterilization
- Applying a 12-D overkill model to every sterilization technology
- Treating a negative BI as independent proof of SAL
- Treating a passing sterility test as validation of sterilization
- Assigning a terminal-process SAL to aseptic processing
- Ignoring minimum, partial, or mixed-load configurations
- Failing to connect development data with routine operating limits
- Failing to reassess SAL-supporting evidence after changes
Regulatory and Standards Framework
For US drug manufacturing, 21 CFR 211.113(b) requires written procedures designed to prevent microbiological contamination of sterile drug products, including validation of all aseptic and sterilization processes.
FDA’s Submission Documentation for Sterilization Process Validation describes information supporting sterilization-process efficacy in human and veterinary drug applications.
Technology-specific standards provide additional requirements and methods. Examples include:
- ISO 11139:2018 and Amendment 1:2024 — sterilization vocabulary
- ISO 17665:2024 — moist-heat sterilization of health-care products
- ISO 11135 — ethylene-oxide sterilization of medical devices
- ISO 11137 series — radiation sterilization of health-care products
- ISO 22441:2022 — vaporized-hydrogen-peroxide sterilization of medical devices
- ISO 11138 series — biological indicators
- ISO 14937 — general requirements for characterization and validation of sterilizing agents and processes for medical devices
Each standard must be applied within its defined scope. Requirements written for medical-device sterilization should not automatically be represented as legally binding pharmaceutical requirements.
Relevant USP chapters include General Chapters <71>, <1211>, and the <1229> sterilization series. USP chapters should be evaluated according to their official status and applicability rather than cited as interchangeable sources of requirements.
The wider regulatory hierarchy is addressed in Sterilization Regulations, Standards, and Validation Lifecycle.
Conclusion
Sterility assurance level is a probability supported by validated sterilization-process evidence. It is not absolute proof of sterility, an observed fraction of failed units, or a result that can be established by testing a small finished-product sample.
D-values, z-values, survivor curves, bioburden, biological indicators, accumulated lethality, and dose measurements provide different parts of the scientific model. Their validity depends on the microorganism, product, sterilization method, exposure conditions, load configuration, and ability to control the routine process.
A defensible SAL claim connects microbial resistance and initial population with worst-case process penetration, equipment qualification, performance qualification, routine monitoring, change control, and requalification.