

Bioprocess Filtration Validation: Clarification, TFF, and Virus Filtration
Introduction
Bioprocess filtration validation provides documented scientific evidence that a filtration operation can consistently achieve its defined process objective under established operating conditions.
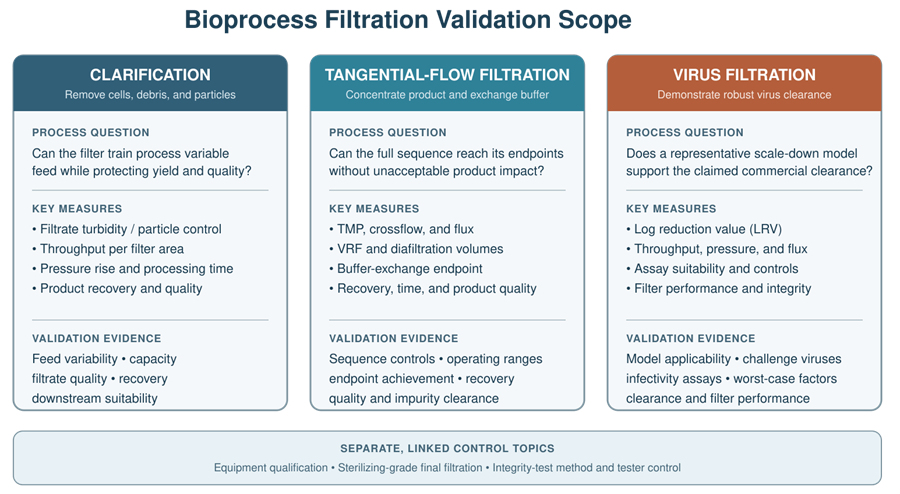
This article addresses three filtration applications:
- Clarification and particulate-removal filtration
- Tangential-flow filtration for concentration and diafiltration
- Virus filtration as a virus-clearance operation
These applications use different separation mechanisms, performance indicators, study designs, and acceptance criteria. They should not be combined under one generic validation approach based only on pressure, flow, and filter integrity.
Equipment installation and functional testing are addressed in filtration skid qualification and lifecycle control. Sterilizing-grade filtration and sterile hold-time validation are addressed separately in sterilizing filtration validation and sterile hold-time control.
Scope Boundaries
This article includes:
- Process definition
- Membrane and filter selection evidence
- Risk assessment
- Feed-material variability
- Scale-down models
- Scale-up and scaling rules
- Validation-study design
- Worst-case selection
- Process parameters and material attributes
- Performance acceptance criteria
- Manufacturing-scale confirmation
- Continued process verification
- Change assessment and revalidation
This article does not cover:
- DQ, IQ, OQ, or equipment-level PQ
- Generic skid architecture
- Pump, housing, valve, or instrument qualification
- Sterilizing-grade final filtration
- Aseptic hold-time validation
- Detailed filter-integrity tester qualification
- General cleaning-validation methodology
- Validation of automated control systems
The physical design of membranes, housings, pumps, tubing, valves, and instruments is addressed in filtration system design and critical components.
Different Filtration Applications Require Different Evidence
| Application | Primary process objective | Typical performance measures | Principal validation concern |
|---|---|---|---|
| Clarification | Remove cells, debris, precipitates, or suspended particles | Turbidity, solids removal, throughput, pressure, filtrate quality, product recovery | Capacity and filtrate quality across expected feed variability |
| TFF concentration | Increase product concentration while retaining the target molecule | Concentration factor, flux, TMP, product recovery, product quality | Retention, yield, fouling, concentration endpoint, and product impact |
| TFF diafiltration | Exchange buffer or remove permeable impurities | Diavolumes, impurity clearance, conductivity, concentration, recovery | Buffer-exchange effectiveness and consistent impurity removal |
| Virus filtration | Remove viruses through a defined retention mechanism | Log reduction value, throughput, pressure, flux, integrity status | Virus clearance under representative and challenging process conditions |
Validation acceptance criteria should reflect the intended process outcome. A filter can operate within its mechanical pressure limit and still fail to provide adequate clarification, recovery, diafiltration, or virus clearance.
Filtration Validation Within the Process Lifecycle
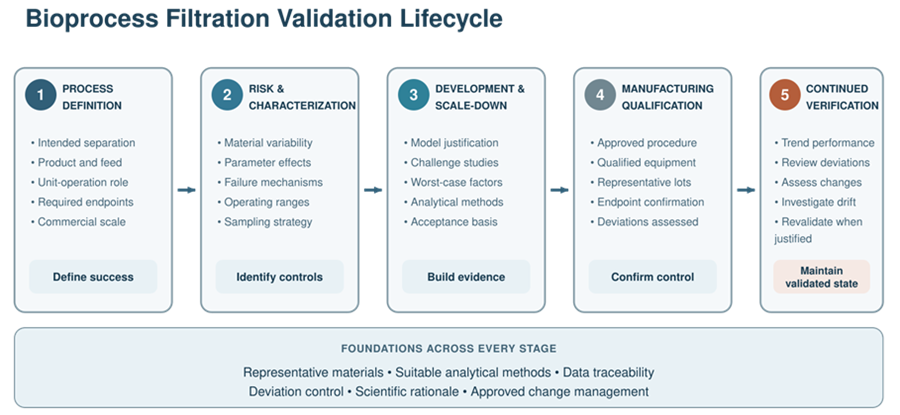
Filtration validation follows the broader process-validation lifecycle:
Process Design
Process-design activities establish:
- Intended filtration objective
- Filter or membrane selection
- Required filter area
- Feed-material characteristics
- Relevant process parameters
- Expected performance
- Scaling approach
- Failure modes
- Preliminary control strategy
Development studies should explain why the selected filter and operating conditions are suitable rather than merely showing that one experiment was successful.
Process Qualification
Process-qualification activities confirm that the commercial process and qualified equipment can execute the filtration step reproducibly.
Evidence may include:
- Development and characterization studies
- Scale-down validation studies
- Manufacturing-scale engineering runs
- Process performance qualification data
- Defined operating ranges
- Approved procedures
- Trained operators
- Appropriate sampling and analytical controls
Not every challenge condition must be reproduced at commercial scale. Some studies, particularly virus-clearance challenges, are generally performed using representative scale-down models. Manufacturing-scale evidence confirms that the commercial operation remains consistent with the validated model and control strategy.
Continued Process Verification
Routine manufacturing data are reviewed to confirm that the process remains within its validated state. Monitoring should detect changes in feed characteristics, fouling, capacity, pressure behavior, yield, processing time, or product quality.
Process Definition
The filtration step should be defined before study conditions are selected.
The process definition should identify:
- Filtration objective
- Position within the manufacturing process
- Feed-material source
- Feed-volume range
- Expected composition and variability
- Filter train
- Membrane material and rating
- Filter or membrane area
- Operating mode
- Process temperature
- Flow and pressure strategy
- Processing-time expectations
- Required filtrate, retentate, or permeate quality
- Product-recovery method
- Flush or chase volumes
- Hold points
- Sampling locations
- Reuse strategy, when applicable
For a staged filtration train, the function of each filter should be defined. A depth filter may provide bulk clarification, a secondary filter may reduce fine particulates, and a downstream membrane may provide a final defined separation function.
Validation should evaluate the complete process sequence rather than treating each filter as an isolated component when upstream performance affects downstream loading.
Process Risk Assessment
Risk assessment should identify how material variability, operating conditions, equipment behavior, and operator actions could prevent the filtration step from achieving its intended result.
Potential risks include:
- Higher-than-expected solids loading
- Increased viscosity
- Product aggregation
- Membrane fouling
- Premature pressure increase
- Reduced flux
- Insufficient throughput
- Product adsorption
- Product passage through the membrane
- Incomplete impurity removal
- Filter bypass
- Incorrect filter installation
- Incorrect membrane area
- Incorrect flow direction
- Excessive shear
- Temperature increase
- Air entrainment
- Processing interruption
- Excessive processing time
- Incorrect diafiltration-buffer addition
- Inadequate product recovery
- Filter-lot variability
- Membrane reuse beyond supported limits
The risk assessment should connect each significant risk to development evidence, process controls, validation studies, routine monitoring, or another justified control.
Risk ranking should not be used to classify every adjustable parameter as critical. Parameter criticality should be based on evidence showing whether variability can affect the process outcome or a product-quality attribute.
Material Attributes and Feed Variability
Filtration behavior depends heavily on the material entering the process. Feed variability should therefore be considered during validation.
Relevant feed attributes may include:
- Solids or cell concentration
- Particle-size distribution
- Turbidity
- Viscosity
- Product concentration
- Aggregate level
- pH
- Conductivity
- Temperature
- Bioburden
- Impurity concentration
- Residual process chemicals
- Time from the preceding operation
- Mixing or settling history
A filtration study performed with an unusually easy-to-filter feed may not represent routine manufacturing. Representative and challenging materials should be selected using development data, manufacturing history, or justified material models.
Where actual worst-case material is unavailable, a representative model may be used if its relationship to the commercial feed is understood and documented.
Filter and Membrane Selection Evidence
Filter selection should be supported by data addressing the intended process rather than supplier rating alone.
Selection studies may evaluate:
- Retention characteristics
- Clarification effectiveness
- Product transmission or retention
- Adsorption
- Product recovery
- Fouling
- Flux decline
- Pressure development
- Throughput capacity
- Chemical compatibility
- Extractables and leachables
- Temperature compatibility
- Sanitization or cleaning tolerance
- Integrity-test compatibility
- Scalability
- Supplier variability
A pore-size rating or molecular-weight cutoff does not independently establish process performance. Performance depends on membrane chemistry, structure, module geometry, feed composition, loading, pressure, flow, temperature, and processing time.
Scale-Down Models
Scale-down models are used when full-scale challenge studies are impractical, unsafe, excessively expensive, or scientifically less controlled.
A scale-down model should reproduce the commercial operation sufficiently to support its intended conclusion.
Model comparability may consider:
- Membrane material and construction
- Flow-path geometry
- Effective membrane area
- Feed composition
- Product concentration
- Load per membrane area
- Flow or crossflow normalized to membrane area
- Transmembrane pressure
- Differential pressure
- Temperature
- Throughput per membrane area
- Processing time
- Prefilter configuration
- Product-recovery method
- Hold and interruption conditions
The study report should explain which commercial features are reproduced, which are scaled, and which cannot be directly represented.
A scale-down model does not need to be physically identical to the manufacturing system. It must be scientifically representative of the process mechanisms and conditions relevant to the study objective.
Scaling and Normalization
Scaling should preserve the variables that control filtration performance.
Common normalized measures include:
Throughput per area = Processed volume / Effective filter area
Flux = Permeate flow rate / Effective membrane area
For TFF concentration:
Volume reduction factor = Initial feed volume / Final retentate volume
For constant-volume diafiltration:
Diavolumes = Total diafiltration buffer volume / Controlled retentate volume
These calculations should use consistently defined volumes and units. The calculation method should specify how system hold-up, samples, flushes, and product-recovery volumes are treated. Linear scaling based only on membrane area may be inadequate when scale changes also affect:
- Flow distribution
- Tubing and piping hold-up
- Pump behavior
- Mixing
- Heat generation
- Pressure loss
- Recirculation time
- Buffer-addition control
- Product-recovery efficiency
Scaling rules should be confirmed at manufacturing scale before routine use.
Validation Study Design
A filtration-validation protocol should define:
- Study objective
- Process and product represented
- Filter or membrane identification
- Material lot and filter lot
- Scale and model rationale
- Equipment configuration
- Controlled parameters
- Monitored parameters
- Challenge conditions
- Sampling plan
- Analytical methods
- Calculations
- Acceptance criteria
- Deviation handling
- Data-review requirements
The number of studies or runs should be justified from process knowledge, variability, model complexity, available development data, and the strength of the evidence package. Validation should not be reduced to an unexplained fixed number of successful runs.
Replicates may be required to demonstrate repeatability, evaluate filter-lot variability, or distinguish actual process effects from analytical or experimental variation.
Selection of Challenging Conditions
The term “worst case” should not be reduced to maximum pressure or maximum process volume. Challenging conditions may include:
- High solids loading
- High viscosity
- High product concentration
- Low or high temperature
- Low or high flow
- Low or high transmembrane pressure
- Maximum throughput per area
- Longest processing time
- Maximum hold before filtration
- Maximum filter reuse
- Minimum or maximum buffer volume
- Process interruption
- Pressure release and restart
- Challenging filter lot
- Reduced prefilter performance
- Feed material near an approved limit
Different conditions may challenge different outcomes. For example:
- High solids loading may challenge filter capacity.
- Low temperature may increase viscosity and pressure.
- High TMP may increase flux but also promote fouling or product passage.
- Long processing time may affect product quality.
- A pause may affect virus-filter performance differently from continuous operation.
The protocol should explain why selected conditions represent meaningful process challenges. Combining every extreme in one run may create an unrealistic condition that cannot occur during manufacturing.
Clarification Filtration Validation
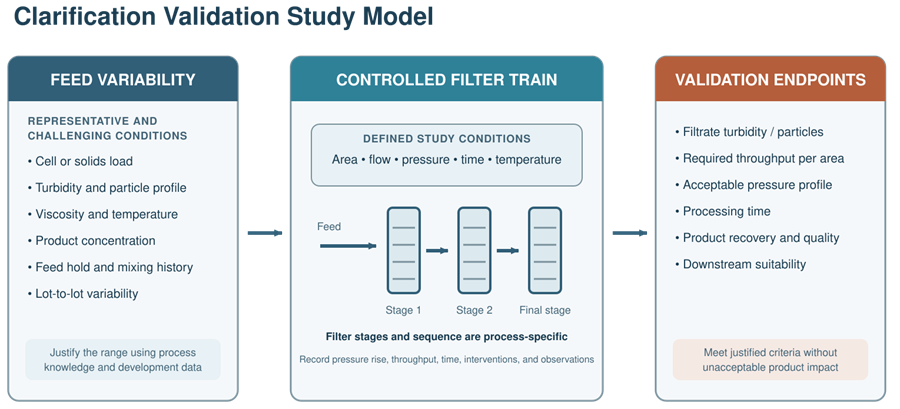
Clarification filtration removes cells, debris, precipitates, aggregates, or suspended particles before downstream processing. Validation should establish that the filter train can accommodate expected feed variability and provide material suitable for the next process step.
Clarification Inputs
Relevant inputs may include:
- Feed volume
- Cell density
- Solids concentration
- Turbidity
- Particle distribution
- Viscosity
- Temperature
- Product concentration
- Feed hold time
- Mixing or settling conditions
- Filter area
- Prefilter arrangement
Clarification Process Parameters
Parameters may include:
- Feed flow
- Differential pressure
- Throughput per area
- Processing time
- Temperature
- Flush volume
- Chase volume
- Maximum pressure endpoint
- Switching criteria between parallel or staged filters
The significance of each parameter should be established from process knowledge and study results.
Clarification Performance Measures
Acceptance criteria may address:
- Filtrate turbidity
- Particle or solids reduction
- Product recovery
- Product-quality attributes
- Impurity removal
- Bioburden reduction, when relevant
- Maximum pressure
- Minimum required throughput
- Processing time
- Downstream-process suitability
A pressure endpoint alone is not sufficient. The study should confirm that filtrate quality and product recovery remain acceptable through the required throughput.
Filter Capacity
Filter capacity should be established with feed material that represents the expected manufacturing range.
Capacity conclusions should consider:
- Feed variability
- Filter-lot variability
- Required safety margin
- Filter train configuration
- Allowable pressure
- Maximum processing time
- Required batch volume
- Flush and recovery volumes
Capacity data generated with a small filter may be scaled by effective area only when the small-scale format and test conditions adequately represent the manufacturing configuration.
TFF Concentration and Diafiltration Validation
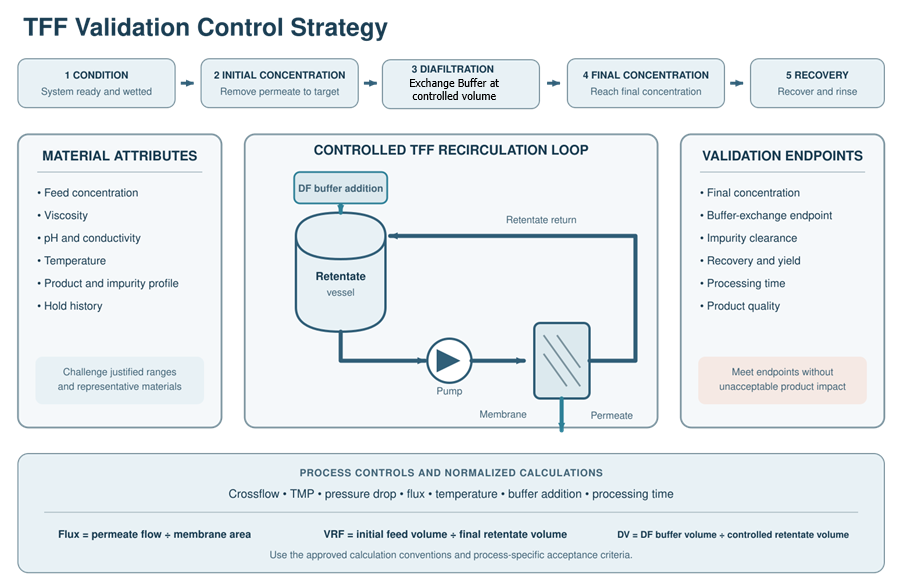
Tangential-flow filtration commonly combines product concentration, buffer exchange, impurity removal, and product recovery within one operation. Validation should evaluate the entire sequence rather than only the final concentration value.
TFF Process Phases
A TFF process may include:
- System preparation and membrane conditioning
- Product loading
- Initial concentration
- Diafiltration
- Final concentration
- Product recovery
- Rinse or chase recovery
- Cleaning, sanitization, or storage when the membrane is reused
Each phase may use different flow, pressure, volume, and endpoint controls.
TFF Parameters
Relevant parameters may include:
- Feed or recirculation flow
- Crossflow
- Feed pressure
- Retentate pressure
- Permeate pressure
- Transmembrane pressure
- Module pressure drop
- Permeate flux
- Temperature
- Feed concentration
- Retentate volume
- Diafiltration-buffer addition
- Processing time
- Membrane loading
- Number of reuse cycles
No single parameter independently describes TFF performance. TMP, crossflow, viscosity, concentration, temperature, and membrane fouling interact.
Concentration Performance
Concentration validation may evaluate:
- Final product concentration
- Volume reduction factor
- Product yield
- Product retention
- Processing time
- Flux profile
- TMP profile
- Pressure-drop profile
- Product-quality attributes
- Aggregate or particle formation
- Temperature exposure
The concentration endpoint may be controlled through volume, weight, concentration measurement, calculated volume reduction, or another justified method.
Diafiltration Performance
Diafiltration validation may evaluate:
- Number of diavolumes
- Buffer-addition accuracy
- Retentate-volume control
- Conductivity endpoint
- pH endpoint
- Impurity clearance
- Buffer-component exchange
- Product concentration
- Product recovery
- Processing time
The required number of diavolumes should be supported by clearance or exchange data. It should not be treated as a universal fixed value. Constant-volume and discontinuous diafiltration may produce different concentration and clearance behavior. The validated strategy should match the commercial mode.
Product Recovery
TFF systems can retain significant product in membrane channels, holders, tubing, manifolds, and the recirculation vessel. Recovery studies should define:
- Drain or transfer sequence
- Air or gas displacement, when used
- Rinse or chase volume
- Rinse composition
- Number of recovery steps
- Acceptance criteria
- Treatment of recovered fractions
Recovery optimization should not compromise product quality by excessive dilution, foaming, air exposure, shear, or processing time.
Membrane Reuse
Where membranes are reused, validation should address:
- Maximum supported number of cycles
- Cleaning and sanitization exposure
- Storage conditions
- Integrity
- Flux recovery
- Retention performance
- Product recovery
- Carryover
- Microbial control
- Cumulative processing time
Reuse limits should be supported by data from representative or challenging membrane history. Passing a hydraulic or integrity test alone may not demonstrate unchanged process performance.
Virus Filtration Validation
Virus filtration is a dedicated virus-clearance operation. Its validation should be integrated into the product’s overall viral-safety strategy.
A virus filter should not be treated as interchangeable with a sterilizing-grade microbial filter. Virus removal depends on the virus, membrane, product matrix, operating conditions, filter loading, and process interruptions.
Viral-Clearance Strategy
The strategy should consider:
- Potential relevant viruses
- Cell substrate and raw-material risks
- Other virus-inactivation or removal steps
- Required overall clearance
- Mechanistic independence of clearance steps
- Virus-filter contribution
- Process conditions represented by the validation model
Virus filtration usually provides one part of a broader, orthogonal viral-safety strategy.
Virus Selection
Challenge viruses may include relevant viruses, specific model viruses, or nonspecific model viruses. Selection should consider:
- Virus size
- Envelope status
- Resistance characteristics
- Assay availability
- Relevance to the production system
- Ability to represent a range of physicochemical properties
The selection and number of viruses should be scientifically justified for the product and manufacturing process.
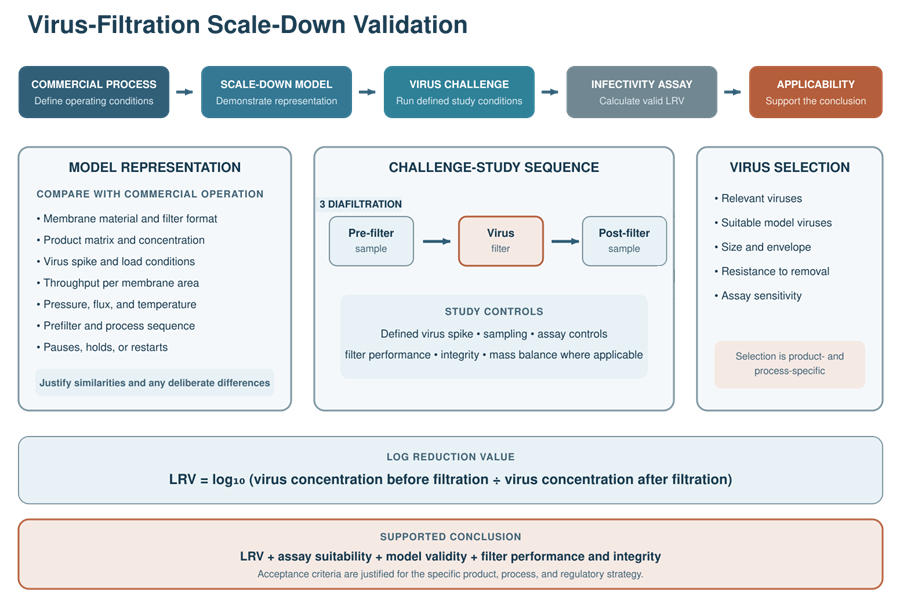
Scale-Down Model
A virus-filtration scale-down model should represent the commercial process with respect to the variables that influence virus retention. These may include:
- Membrane type
- Filter construction
- Membrane area
- Product matrix
- Product concentration
- pH
- Conductivity
- Temperature
- Pressure or flux strategy
- Throughput per area
- Prefilter use
- Filter loading
- Processing duration
- Pause or interruption conditions
- Filter lot
The virus spike should be designed so that it does not unintentionally change the process-fluid properties in a way that makes the study unrepresentative. Any effect of the spike preparation on protein concentration, ionic strength, viscosity, fouling, or filterability should be evaluated.
Log Reduction Value
Virus-removal performance is commonly expressed as:
LRV = log10(Virus concentration before filtration / Virus concentration after filtration)
The calculation should account for:
- Sample volumes
- Assay dilution
- Assay variability
- Detection limit
- Cytotoxicity
- Interference
- Sample infectivity
- Virus recovery
- Results below the quantitation or detection limit
An log reduction value (LRV) result is meaningful only in the context of a suitable assay and representative process model.
Virus-Filtration Challenge Conditions
Studies may evaluate:
- Maximum throughput
- High protein concentration
- Challenging pH or conductivity
- Low or high temperature
- Low or high pressure
- Low or high flux
- Filter loading
- Prefilter variability
- Process pauses
- Pressure release
- Restart after interruption
- Extended processing time
- Filter-lot variability
The conditions most challenging to virus retention may not be the same conditions that produce the highest pressure or lowest flux. Study selection should consider the filter’s retention mechanism and available development knowledge.
Virus-Filter Performance Indicators
Study acceptance criteria may include:
- Required virus reduction
- Acceptable filter integrity
- Required process volume
- Pressure and flow limits
- Processing time
- Product recovery
- Product-quality results
- Assay suitability
- Mass balance or virus recovery
- Model comparability
A successful post-use integrity test supports evidence that the filter remained intact, but it does not independently demonstrate the claimed virus reduction for a process not represented by the validation study.
Validation of Process Interruptions
Interruptions may alter filtration performance through:
- Membrane relaxation
- Product deposition
- Concentration polarization
- Pressure redistribution
- Air entry
- Temperature change
- Extended exposure time
- Restart transients
The validation strategy should identify interruptions that can reasonably occur during manufacturing, such as:
- Planned hold
- Buffer replenishment
- Container change
- Equipment alarm
- Power interruption
- Pump stop
- Pressure release
- Filter switching
- Sampling
- Operator intervention
The study should define whether the process may restart, which conditions must be checked, and whether material accumulated before the interruption remains acceptable.
Filter-Lot and Raw-Material Variability
Filter and raw-material variability can affect capacity and retention.
The validation program should consider:
- Multiple filter lots where variability could affect the conclusion
- Supplier manufacturing changes
- Membrane-material changes
- Filter-format changes
- Raw-material or formulation changes
- Product-concentration variability
- Changes in upstream clarification
- Changes in cell-culture or fermentation performance
Not every study requires multiple filter lots. The decision should reflect supplier controls, prior knowledge, filter variability, process sensitivity, and the importance of the performance claim.
Sampling and Analytical Methods
Sampling should be designed to demonstrate process performance without creating contamination, pressure, volume, or hold-time conditions that do not represent manufacturing. The protocol should define:
- Sampling locations
- Sampling times
- Required sample volume
- Sample handling
- Storage conditions
- Test methods
- Replicates
- Retest rules
- Data treatment
Analytical methods should be suitable for the sample matrix, concentration range, and intended conclusion. Potential tests include:
- Product concentration
- Turbidity
- Particle concentration
- Conductivity
- pH
- Bioburden
- Product potency
- Aggregates
- Impurities
- Residual buffer components
- Viral infectivity
- Filter integrity
Analytical variability should be considered when establishing acceptance criteria and interpreting differences among runs.
Manufacturing-Scale Confirmation and PPQ
Manufacturing-scale confirmation should demonstrate that the commercial filtration system executes the process consistently within the established strategy. Evidence may include:
- Actual feed-material variability
- Commercial filter configuration
- Operating profiles
- Pressure and flow behavior
- Processing time
- Endpoint achievement
- Product recovery
- Product-quality results
- Operator execution
- Batch-record controls
Process performance qualification should confirm the integrated manufacturing process. It should not be expected to reproduce every destructive, microbiological, viral, or extreme-condition study performed during development.
Scale-down validation, characterization studies, equipment qualification, and PPQ provide different types of evidence. Together they support the validated state.
Validated Operating Ranges and Proven Acceptable Ranges
Validation should define operating controls supported by process evidence. The control strategy may include:
- Target values
- Normal operating ranges
- Proven acceptable ranges
- Alert limits
- Action limits
- Procedural endpoints
- Equipment-protection limits
These limits should not be treated as interchangeable.
An equipment-protection limit may prevent membrane rupture but may not ensure acceptable product quality. A proven acceptable range may be wider than the normal operating range but still require controlled assessment before routine operation at its extremes.
A multidimensional filtration process should not be represented as if any combination of individually acceptable parameter values is automatically validated. Parameter interactions may require additional restrictions.
Deviations From Validated Conditions
Operation outside an approved range should be documented and assessed. It does not automatically mean the batch or validation is unacceptable. The assessment should consider:
- Parameter and magnitude of the excursion
- Duration
- Process phase
- Material characteristics
- Other operating parameters
- Filter loading at the time
- Product-quality results
- Validation and development data
- Potential impact on capacity, retention, clearance, or recovery
A process excursion should not be justified only because the filter remained below its mechanical pressure rating.
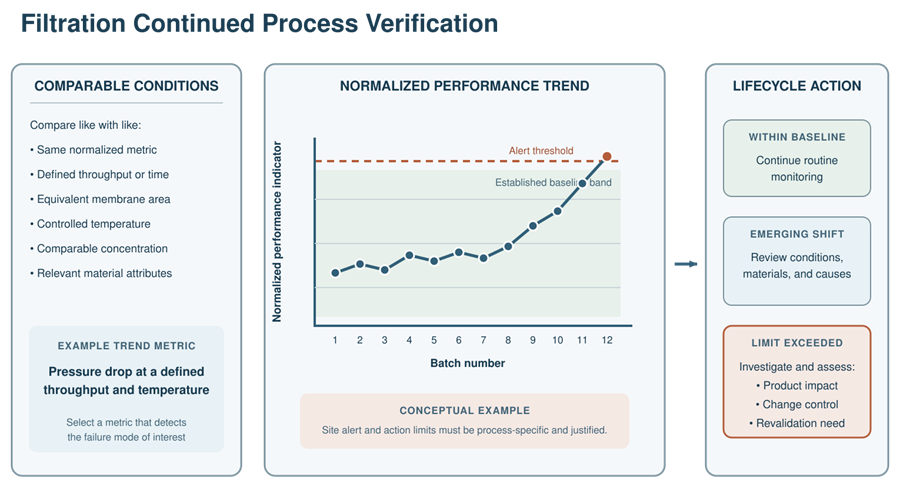
Continued Process Verification
Routine monitoring should confirm that filtration behavior remains consistent with the established baseline.
Clarification Monitoring
Useful measures may include:
- Initial feed turbidity
- Filtrate turbidity
- Differential pressure at defined throughput
- Maximum pressure
- Throughput per filter area
- Processing time
- Filter-use or switching pattern
- Product recovery
- Downstream-process performance
TFF Monitoring
Useful measures may include:
- TMP profile
- Module pressure-drop profile
- Permeate-flux profile
- Crossflow
- Processing time
- Volume reduction factor
- Diavolumes
- Buffer consumption
- Final concentration
- Product recovery
- Product-quality attributes
- Membrane-use cycle
Comparisons should be made at equivalent process conditions. Comparing pressure values from different volumes, concentrations, temperatures, or membrane areas can produce misleading trends.
Virus-Filtration Monitoring
Routine manufacturing does not normally reproduce virus-clearance studies. Continued verification therefore focuses on confirming that the commercial process remains represented by the validated model. Monitoring may include:
- Filter identity and lot
- Product-matrix attributes
- Prefilter configuration
- Throughput per area
- Pressure and flow profiles
- Processing time
- Interruptions
- Integrity-test status
- Deviations
- Supplier changes
Trend limits should distinguish normal process variability from conditions requiring investigation.
Change Control and Revalidation
Changes should be evaluated for their potential effect on filtration performance and the applicability of existing validation evidence.
Changes may include:
- Membrane material
- Pore rating or molecular-weight cutoff
- Filter format
- Filter area
- Supplier
- Manufacturing location
- Prefilter
- Feed composition
- Product concentration
- Batch size
- Operating pressure
- Flow or crossflow
- Temperature
- Processing time
- Diafiltration-buffer composition
- Number of diavolumes
- Membrane reuse limit
- Cleaning or storage method
- Process interruption strategy
- Scale-down model
- Virus-filter configuration
The assessment should determine whether existing studies remain representative or whether bridging, targeted revalidation, or a new validation study is required.
Changes should be processed through change-control impact assessment.
Validation Documentation
The validation package should provide a traceable connection among:
- Process objective
- Risk assessment
- Development data
- Filter-selection rationale
- Scale-down model
- Scaling rules
- Study protocol
- Raw data
- Analytical results
- Calculations
- Deviations
- Acceptance criteria
- Study conclusions
- Commercial control strategy
- Continued-verification plan
The report should state what was demonstrated and what was not demonstrated. Conclusions should remain within the studied materials, filter configurations, operating conditions, and justified scaling relationships.
Regulatory Context
The FDA guidance Process Validation: General Principles and Practices describes process validation as a lifecycle activity extending from process design through commercial production.
The FDA guidance Q9(R1) Quality Risk Management provides principles for risk-based decisions across pharmaceutical development, manufacturing, and lifecycle management.
For biotechnology products derived from human or animal cell lines, the FDA guidance Q5A(R2) Viral Safety Evaluation of Biotechnology Products Derived From Cell Lines of Human or Animal Origin describes risk-based viral-safety evaluation, virus testing, and viral-clearance studies.
Conclusion
Bioprocess filtration validation should be based on the specific separation objective rather than a generic demonstration that liquid can pass through a filter.
Clarification validation establishes capacity, filtrate quality, and product recovery across representative feed variability. TFF validation establishes concentration, diafiltration, impurity clearance, product retention, recovery, and product quality across the defined process sequence. Virus-filtration validation establishes virus removal using a scientifically representative model and justified challenge conditions.
The combined evidence should define the commercial control strategy, establish the applicability of scale-down studies, support manufacturing-scale performance, and provide a basis for continued verification and change assessment throughout the process lifecycle.